
Charger Utilization Report - July 2025
New data, new insights!

We’ve previously covered utilization of ~20% DC chargers, as of March 2025, in mid June 2025. We looked at utilization in the months April and May 2025.
Today, we look at ~21% of DC chargers as of June 2025 covering utilization metrics till July 2025. The report is available on PowerBI for select states and the entire country as a whole. While we increased our absolute number of chargers covered, the charging infrastructure also grew considerably, putting us back to ~20%.
Our latest estimates reveal a network of 10746 charging stations or 14008 chargers or 20791 connectors across India. We’ve meticulously analyzed data from ~21% of the CCS2 charging ecosystem, not including hubs, capturing the pulse of the country. For the past four months, our dedicated team has tirelessly navigated Charge Point Operator apps, monitoring the infrastructure with precision and passion.
If you are looking to break into the EV industry, whether you're aiming to join the industry or looking for your next big opportunity within it, this form is for you. We will share selective list of candidates with companies looking to hire candidates.
Psst. First two people to fill this form get an invite to attend Ather’s Community Day event, later this month, in Bengaluru.
Caveats
Before we dive into the data, let us note down some caveats :
To ensure fairness, we’re keeping CPOs and specific station names under wraps for all our articles and reports. Instead, we’re showcasing average utilization at the district level by aggregating data from multiple CPOs to provide a clear, unbiased picture.
This report measures charger usage based on time, not energy dispensed.
Our current analysis covers data from April 2025 to July 2025. Our previous article covered from April 2025 to May 2025.
We’ve considered only public CCS2 chargers accessible to all, including electric cabs.
Charging hubs have not been considered in this analysis.
We recently released updates to three of our flagship products which you can check out here.
Here is the document detailing our terms and conditions, measurement techniques, data caveats, disclaimers, disclosures, etc.
Credits
I’d like to thank my team at ExpWithEVs, for carrying out this mammoth data exercise. Special mention of Garvit who has been instrumental in handling the data and presenting it on PowerBI.
If you are a CPO willing to contribute to this data, in exchange for benefits, please click here.
As a gesture of good faith, we are pushing the update for these two months for free to our existing EVUtilBI clients. If you are looking to get onboarded, now is the best time!
In this report, we will look at
Country level utilization
State level utilization
District level utilization
Utilization in non metros and metros
Utilization across select highways
Utilization across amenities
Some Bonus charts
We spent the Independence Day weekend in Lucknow, gorging great food. Check out our stats here. Running costs ~ INR 0.9/km
If you’d like to pitch a story to ExpWithEVs, please click here.
Let’s dive in
How to read the data - When we say that, for example, Bengaluru’s Malls saw a utilization of around 10% at 4PM, it should be interpreted as : of all the surveyed chargers in Bengaluru Malls, from April 2025 to July 2025, around 10% of the chargers were found to be occupied at 4PM.
Essential Reading - These articles will give you good insight into our earlier findings - Article 1, Article 2, Article 3
Fun Reading - Here’s an article from two years ago talking about ChargeZone’s utilization. Naturally, ChargeZone stopped sharing such infographics on their social media page.
Country
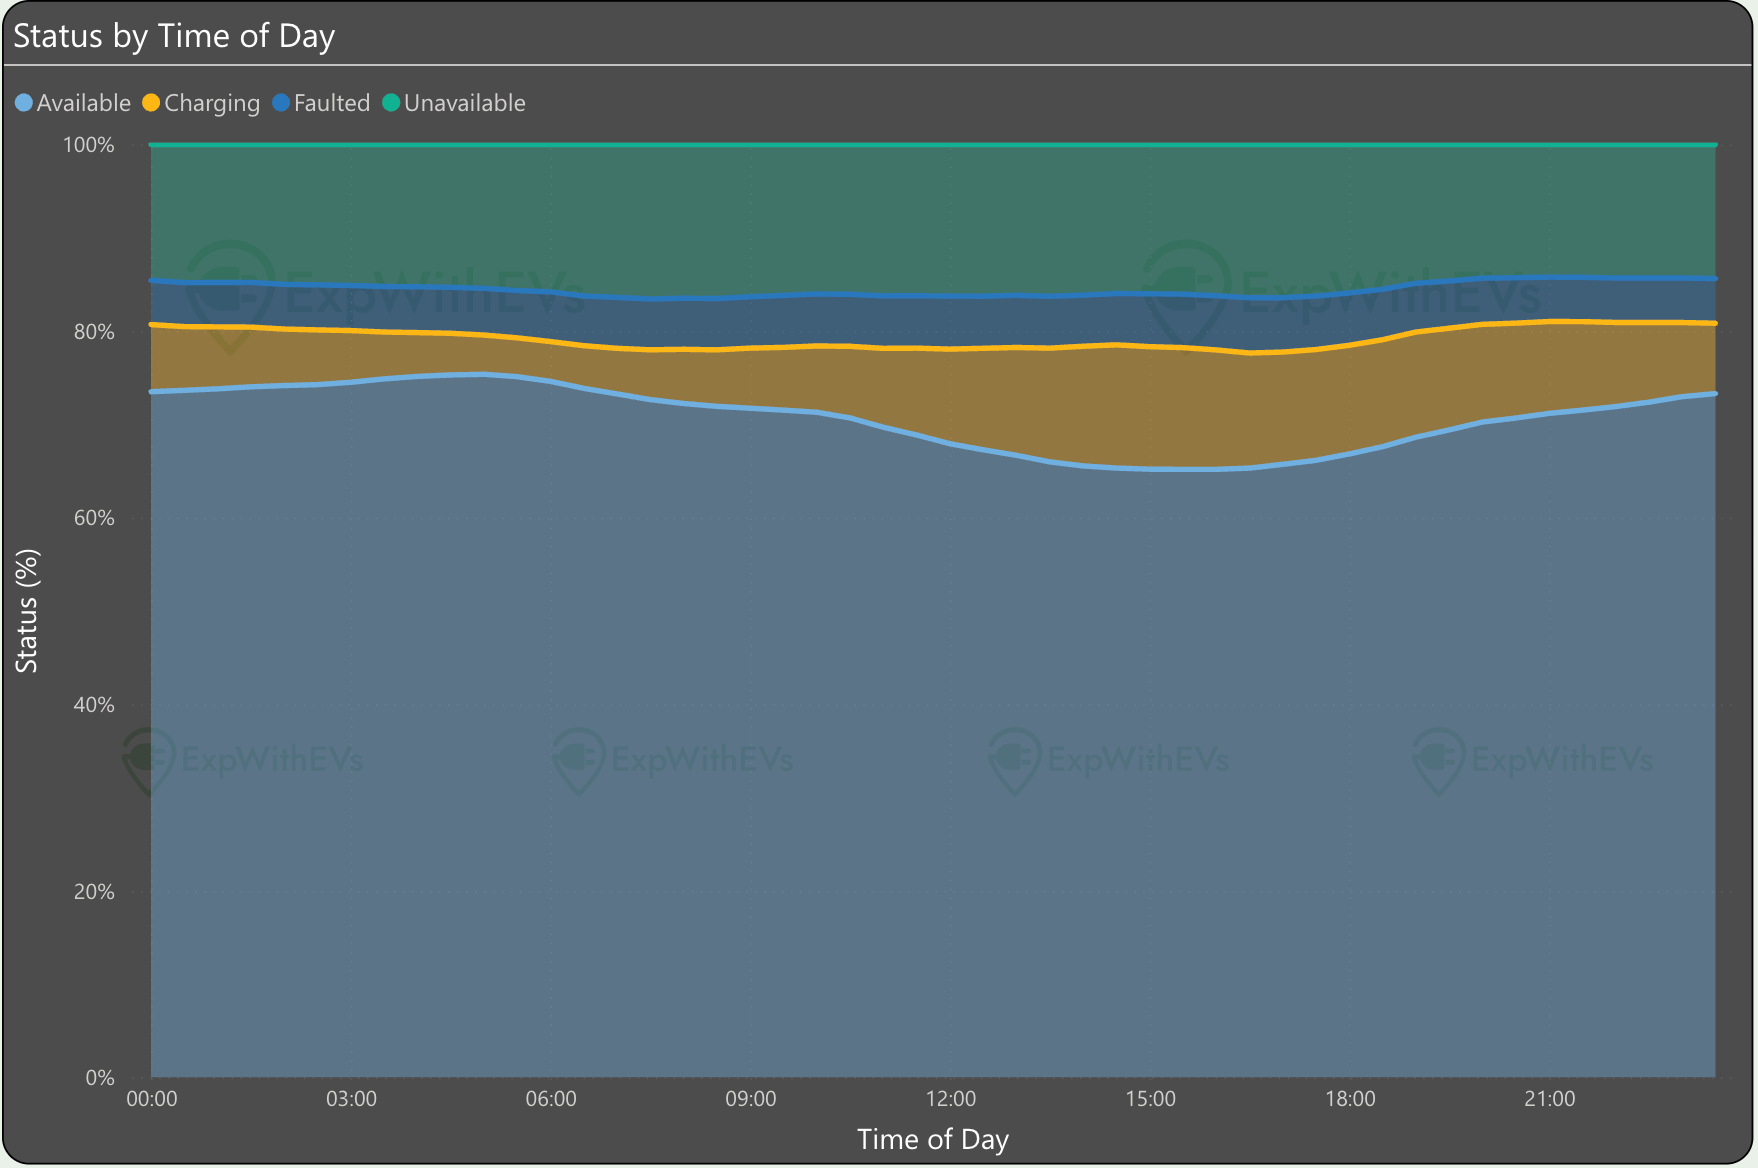
As the summer months pass, the powercuts and load shedding reduces, allowing more chargers to be available. May and June 2025 had higher amounts of chargers not available.
The peak is still at around 2:30 pm with around 13.2% of the sampled network in use. The average time based utilization has fallen to around 8.36% as compared to just over 10% in the previous report.
From around 12PM to late evening at around 9PM, the utilization is never below 10%.
The number of unavailable chargers has stayed consistent across the surveyed sample and the dataset.
