
[Corrected] 2506 EV Charging Infra
State of EV charging in India - 8th edition - June 2025

Unfortunately, the article was published with incorrect numbers due to a backend error. I have corrected them and have republished the article. I apologise for the confusion.
This is the eighth edition on the state of Indian EV Charging infrastructure. This report contains charts depicting trends across the industry over two years, CCS2 and Type2 connectors, leading charge point operators in each zone, non working connectors, infrastructure in major metro cities across the country.
Here are some of the older reports :
September 2022, February 2023, September 2023, February 2024, September 2024, December 2024, March 2025
And now, June 2025.
P.S. : The disclaimer about each report is mentioned in the above link.
Today, we look at the charging infrastructure from a high level overview. We look at the trends and growth of the charging infrastructure in India, across the CPOs and states. A quick primer on the details about various Charging Infrastructure reports are available here.
This report is hosted on PowerBI and you can get your hands on it today. Alternatively, we’ve also come up with an Executive Summary in a PDF version which is also available today. You can jump to the relevant section below to get access.
Annual premium subscribers to this blog will be able to request a 24h access to this PowerBI instantly. Monthly subscribers can request for any chart of their choosing from the report. More details here.
We are currently in Hong Kong, attending the Battery Asia Show. A detailed trip report will be shared with our premium subscribers!
Later this week, we will also be present at EVReporter’s Fleet EV event in New Delhi on Friday, 18th July 2025. If you are building in the EV space, this is one of the better events to attend in India.
You can also read our recently released article on comparing various kinds of route planners in India.

We are happy to share that we’ve added ten more CPOs to our list and are now updating the data of 59 CPOs for June 2025.
Updated list of CPOs can be found in the data disclaimers agreement here.
Let’s dig in
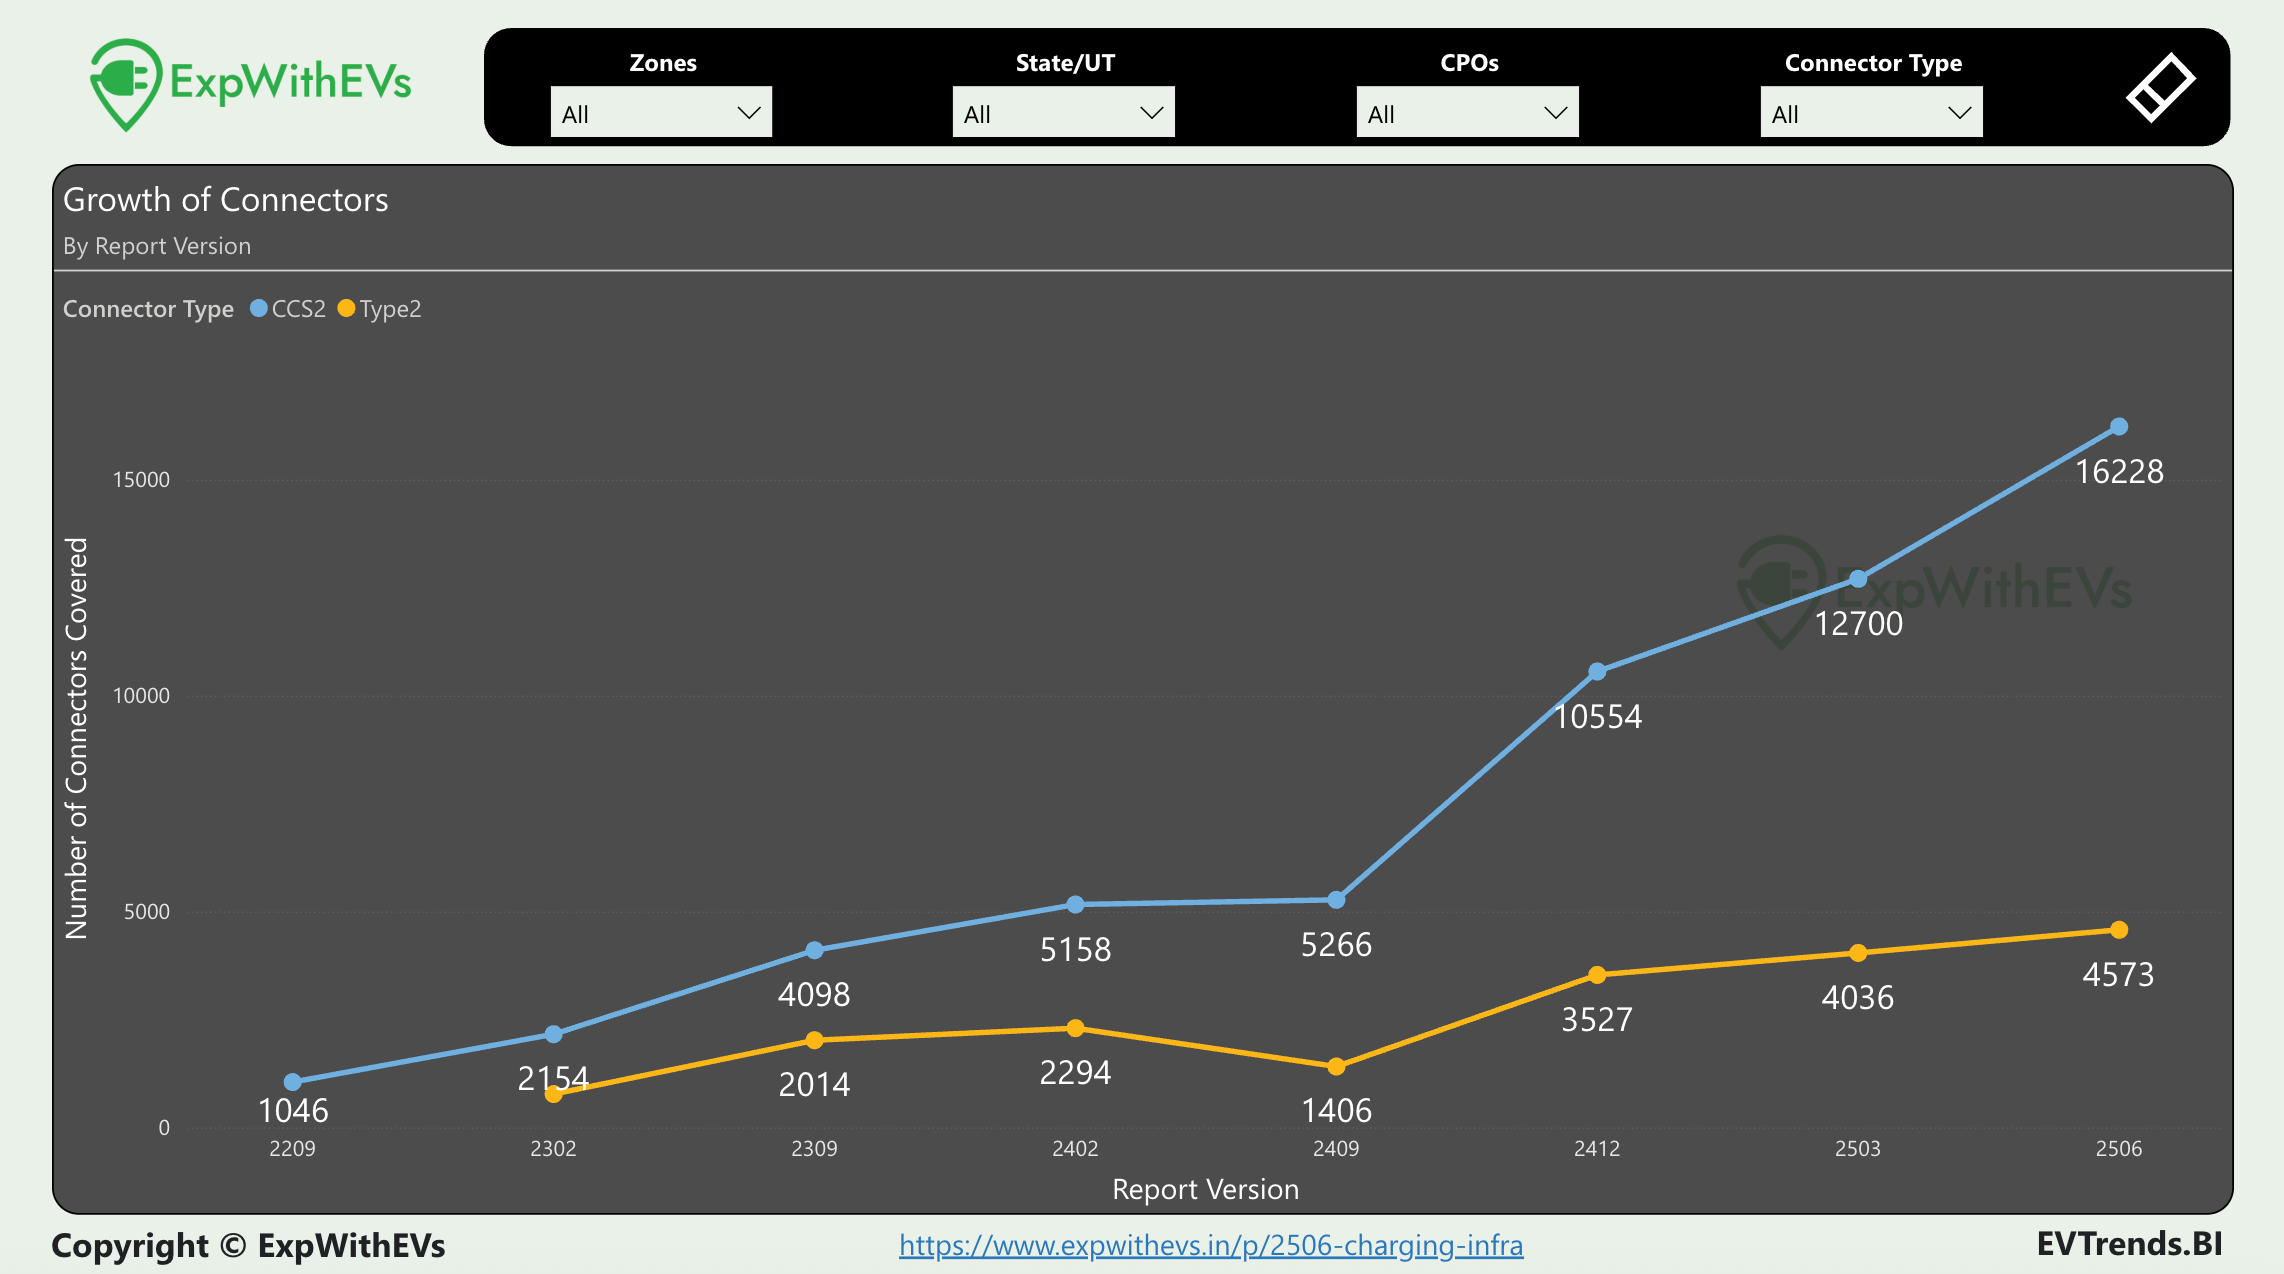
We are close to 20,800 CCS2 and Type2 public connectors in India! We were at almost 16,000 six months ago.
For a more like to like comparison, let’s look at the data from December 2024 to June 2025. The CCS2 charging infrastructure has grown much faster in April to June quarter as compared to January to March.
In the last quarter, the growth in number of connectors was close to 25%.
For Type2 infrastructure, the growth has remained steady across both quarters.
This quarter, Jio-bp opened up its previously captive BluSmart chargers in hubs for the general public. Tata Power and ATGL have removed chargers and installed new hardware at newer locations. Zeon has been active in upgrading and swapping out its charging infrastructure. IOCL has also installed new hardware for their 120kW and 60kW chargers. HPCL has partnered with Statiq to cross list their chargers.
Tata.EV has recently started funding some of the already installed chargers by existing CPOs like ChargeZone, Zeon, Tata Power and Statiq. It is likely that Tata.EV will also fund newer charging stations. Tata.EV provides discounted rates for Tata.EV cars at these select charging stations. We’ve started tracking these separately and added it to our database.
With complete access to EVTrendsBI, you can dive into the trends and see how CPOs have ramped up their installations over the years.
Pan India Zonal Growth

The West Zone has narrowly held on to the lead over the South Zone. The Central and East zones are equivalent to charging infrastructure of February 2023 for the West and South Zones, indicating a lag of roughly two and a half years.
The CCS2 and Type2 chart splits across all eight reports are available for premium subscribers at the end of this report.
States
CCS2

Maharashtra has retained its humongous lead in CCS2 connectors. Karnataka is now in second place from previously fourth position. Uttar Pradesh too has jumped up two places to the sixth spot.
The first northern state in this list is Uttar Pradesh, at 6th rank. Two quarters ago, as of December 2024, Haryana was the first northern state at 7th place. Today, Haryana is at 8th spot. Madhya Pradesh, ranked 11th is the largest state from Central India.
No state is close enough to Maharashtra to take the top crown. Karnataka and Gujarat are close enough to swap positions in the next quarter.
Our premium subscribers can see the chart with numbers and also see something special happening in Punjab.
Type2

The order has remained unchanged for the top five states from March 2025 to June 2025. Karnataka has shown good growth in connectors and is inching closer to Maharashtra.
Manipur, in North East India, is a new entrant in this list.
Metro Cities
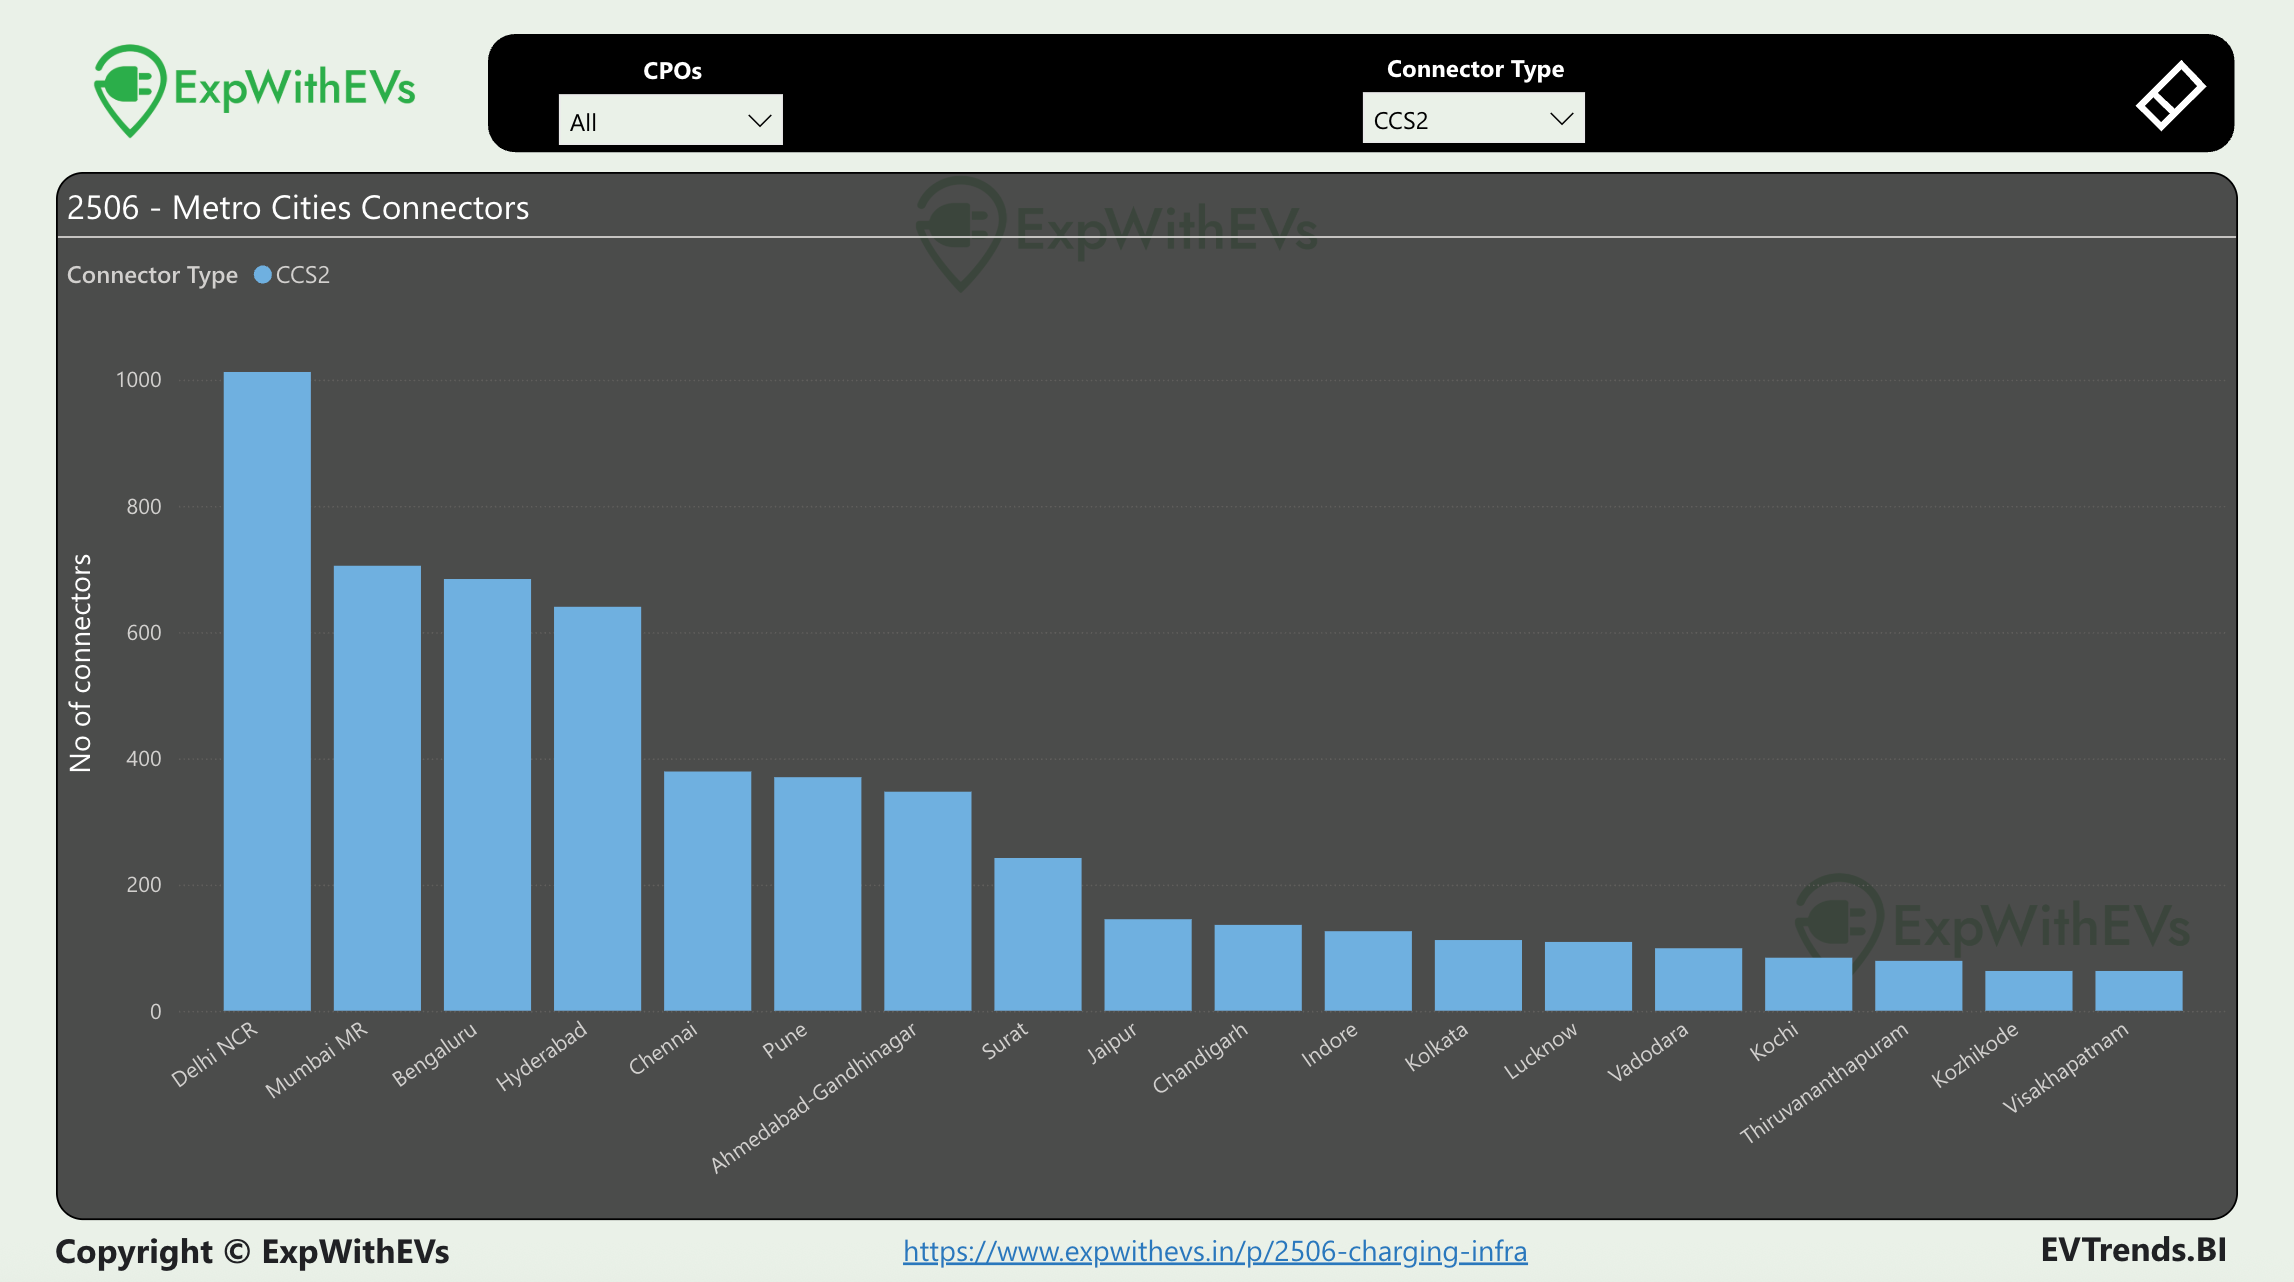
Delhi NCR leads this list comfortably with close to 1000 CCS2 connectors present in the city. It is important to study what is happening in the cities because of observations here.
In December 2024, only six cities had over 100 CCS2 connectors. Today, that number stands at 13 cities out of 18 that we monitor. The top four cities now have more than 500 connectors. I am hoping that by December 2025, we are at 500 connectors in atleast 10 cities.
CPOs
CCS2
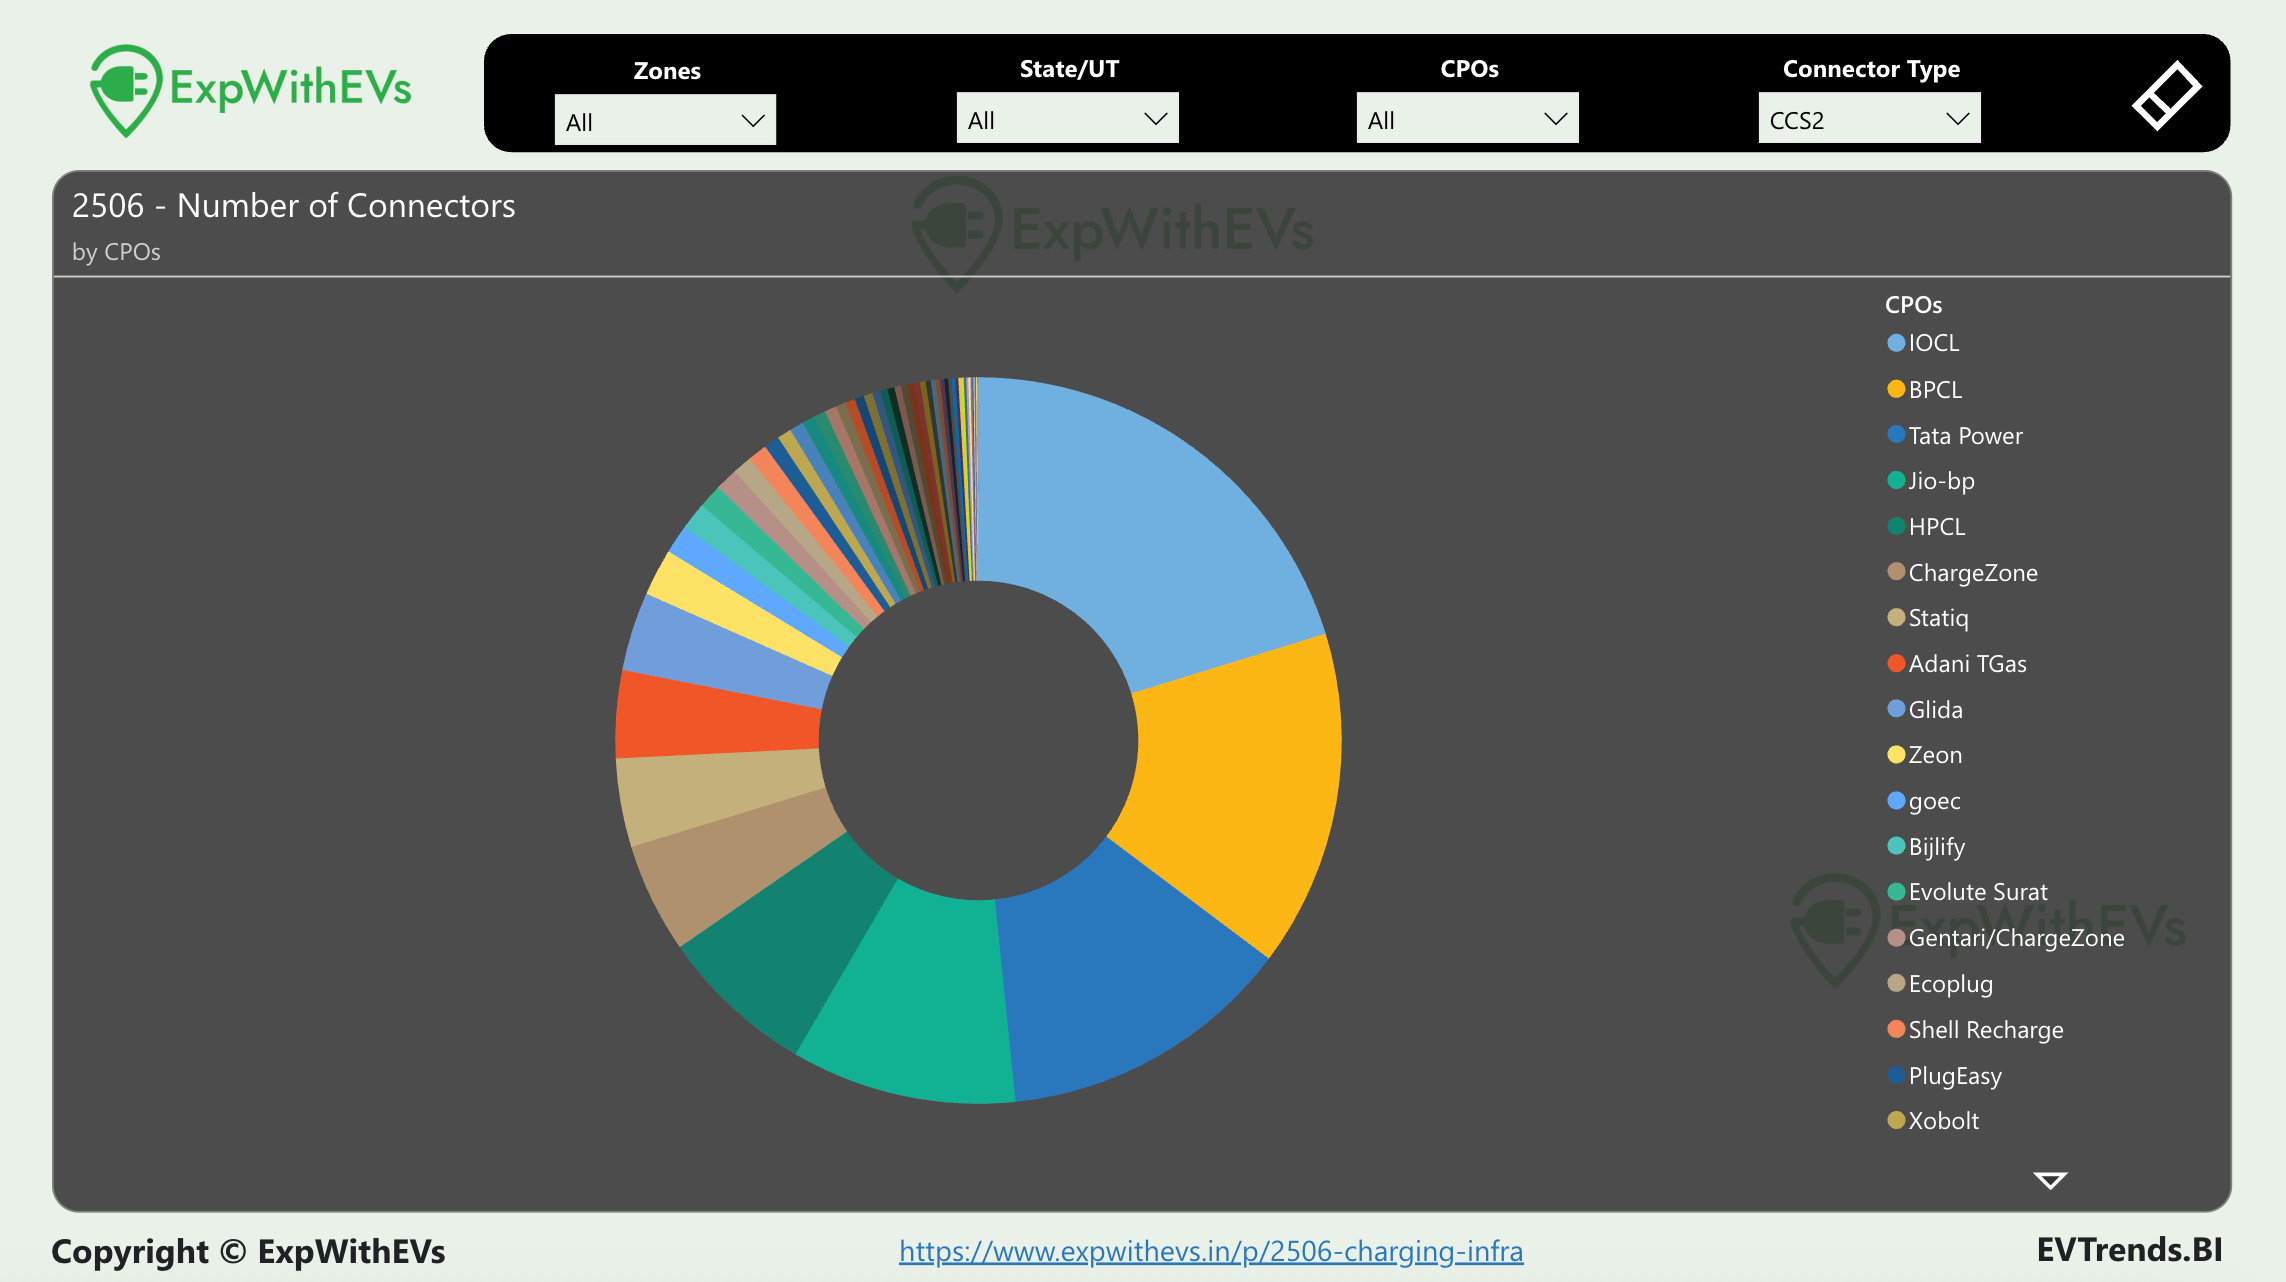
IOCL continues to wear the crown of most CCS2 connectors, one that it took from Tata Power last quarter. Tata Power is now third, by making the way for BPCL for the second spot. BPCL has a comfortable lead over Tata Power.
Jio-bp is in fourth position and the only private player in a position to challenge Tata Power — something which can be only achieved with a sizeable investment.
Premium subscribers will be able to see zonal distribution for South, West and North Zones.
Non working CPOs
In this section, we will focus on the non working connectors by majorly public run companies. Before we get to that, let’s understand the trend and pattern of non working connectors so far. You can read how we measure non working connectors here.
45.05% of CCS2 connectors were not found to be working during our study spanning across June 2025. Similarly, 43.54% of Type2 connectors were not found to be working during the same study.
33.65% of CCS2 connectors and 43.61% of Type2 connectors were not working in March 2025. The non working connector % has gone up significantly for CCS2 connectors. The industry needs to take a hard look at what’s wrong and how to fix it.
Naturally, with EVTrendsBI, you can dive deeper into the trends and understand which CPOs have the most number of non working connectors in specific states.
While the industry does that, every Indian tax payer should pay attention to how Public Sector Companies are spending our hard earned money on charging infrastructure.

IOCL, with over 4000 connectors, was found to have 96.88% downtime. In the previous report, it was at 95.27%. It must take a real special talent to go worse from 95.27% to 96.88%.
BPCL, too has shown similar trends. It went from 73.62% non working connectors to 79.64%. I wrote about this exact issue around two years ago for The Ken, but there has been no improvement in their services.
HPCL also deserves a special mention because their services have also gotten worse. They went from 30% non working connectors in March 2025 to 64.32%.
No one in these companies is incentivised to keep the chargers online. Absolutely, no one. If IOCL, BPCL and HPCL get their act together, they will significantly improve e-mobility across the country. Private players will have to further invest in charging infrastructure to compete with the public CPOs. Related reading.
I appeal to journalists reading this article, please dig deeper into this and find out why the public CPOs are not interested in maintaining their charging infrastructure, why they are hell bent on wasting public money. I am happy to collaborate with anyone willing to file RTIs to get a response from these entities.
P.S. : Evolute Surat didn’t make this list because none of their connectors were found to be offline. Maybe IOCL, BPCL and HPCL heads of EV Charging Infrastructure must learn a thing or two from Evolute Surat.
Premium subscribers can see what happens if we remove the above public entities from our non working % connectors calculation.
BEV Registrations

This data is till April 2025. In four months of 2025, we are on the verge of crossing the halfway mark of sales in calendar year 2024. This shows that the market for e4W is expanding at a rapid pace in 2025.
To put it in context, here are the sales from the first four months across the years.

With new electric car launches packed in the second half of the year, these absolute numbers should get a good boost.
Get this intelligence in your hands
There are two ways to go about this.
EVTrendsBI
This PowerBI tool consists of 12 PowerBI charts with varying slicers. You can take a look at this article to see sample charts.
Three charts talk about trends in growth of connectors, zonal distribution and non working %
The next six charts are about 2506 data dissecting into distribution by State, drilled down to CPOs; a map to see the numbers across states visually, connectors by CPOs, non working connectors by CPOs, non working connectors by States, and Connectors across metro cities in India.
One chart is called Playground which allows you to explore the data the way you want.
Two charts are about electric four wheeler registrations statewise and RTO wise over the last few years via Vahan.
An annual subscription is available for corporates. This will include three additional data updates, ie September 2025, December 2025 and March 2026.
Please read the terms and conditions for the offer mentioned in this article carefully before buying.
Please note, the data cannot be exported in CSV or Excel format.
Non premium subscribers get two licenses for their company. Tax invoice can be shared on request. Bank transfer options are also available. TDS can be deducted when paying through bank payments.
Premium subscribers can use this link to get access to 2506 EVTrendsBI.
Premium subscribers get four licenses for their company. Tax invoice can be shared on request. Bank transfer options are also available. TDS can be deducted when paying through bank payments.
Executive Summary - PDF
The executive summary PDF contains the following :
Map for CCS2 and Type2 chargers for states across India
Number of CCS2 and Type2 chargers by CPOs
Number of CCS2 and Type2 chargers by states
Non working chargers across CPOs
Non working chargers across states
Number of CCS2 and Type2 chargers by CPOs for each State / Union Territory
Non working CCS2 and Type2 chargers by CPOs for each State / Union Territory
Number of CCS2 and Type2 chargers by State / UT for each CPO
Non working CCS2 and Type2 chargers by State / UT for each CPO
This document is hosted on our credentialed platform and can be accessed only through it. You will not be able to download the PDF. Please note, there will be no data updates to the PDF and the data is restricted to June 2025.
Regular i.e. non premium subscribers will get access to two licenses.
Premium subscribers can save money (discount!) and get four licenses for their organisation.
Acknowledgement
EVTrendsBI was created by Priyans Murarka and Garvit Singh. This wouldn’t have been possible without the efforts of our data entry team.
All rights reserved with Priyans Murarka @ ExpWithEVs.
The data from here and this article cannot be repackaged or sold without explicit written permission of ExpWithEVs.
