Utilization
The report you've been eagerly waiting for
Buckle up for a groundbreaking journey into the heart of India’s electric vehicle revolution! We’re thrilled to unveil our exclusive findings on public charger utilization across the nation through this article and our cutting-edge, brand new, PowerBI tool, EVUtilBI. This first-of-its-kind report dives deep into how India’s four-wheeler (4W) electric vehicles are powering up on public infrastructure, offering you unparalleled insights into the future of sustainable mobility.
Our latest estimates reveal a network of 9062 charging stations or 11827 chargers or 16736 connectors across India. We’ve meticulously analyzed data from 20% of the CCS2 charging ecosystem, capturing its pulse like never before. For two months, our dedicated team has tirelessly navigated Charge Point Operator (CPO) apps, monitoring the infrastructure with precision and passion. Their relentless commitment brings you this report, designed to bring in accountability and transparency for India’s EV future.
If you are a CPO willing to contribute to this data, in exchange for benefits, please click here.
If you’d like to pitch a story to ExpWithEVs, please click here. Read our last week’s story by Jaideep Saraswat on EV charger accessibility for people with disabilities.
ExpWithEVs is attending the Mobility Tech Asia show in Hong Kong next month! If you are around, do say hi.
Before we dive into the data, let us note down some caveats :
To ensure fairness, we’re keeping CPOs and specific station names under wraps for all our articles and reports. Instead, we’re showcasing average utilization at the district level by aggregating data from multiple CPOs to provide a clear, unbiased picture.
This report measures charger usage based on time, not energy dispensed.
Our current analysis covers data from April 2025 and May 2025.
We’ve considered only public CCS2 chargers accessible to all, including electric cabs.
Charging hubs have not been considered in this analysis.
Premium subscribers have already received deeper insights on email. You can click here to read more.
Credits
I’d like to thank my team at ExpWithEVs, for carrying out this mammoth data exercise. Special mention of Garvit who has been instrumental in handling the data and presenting it on PowerBI.
Let’s dive in
Country
Figure 1 offers a glimpse into how India charges its EVs. The peak occurs around 2:30 PM, when roughly 16% of the sampled network is in use. On average, just over 10% of chargers are occupied throughout the day.
But what’s more intriguing is what happens before the afternoon rush. Charging activity hits its lowest point around 5 AM, with utilization dipping to 4.6%. It then rises steadily to 7.6% by 8:30 AM, a modest but noticeable jump of 3%. After that, the pace slows, increasing by only 1.5% to reach 9% at 10 AM.
From 10 AM onwards, usage stays strong. For the next 13 hours, till 11 PM, utilization never dips below 9%.
The numbers raise compelling questions: Who’s plugging in at fast chargers during the dead of night? Why does charging spike post-lunch? And what role do commercial fleets, especially private cabs, play in this pattern?
To dig deeper, we’ve broken down this trend by metro and non-metro regions—available exclusively here to our premium subscribers.
State
This came as a surprise: the highest utilization wasn’t in Maharashtra or Karnataka—states typically seen as EV front-runners—but in Telangana, with an average utilization of 18.92%.
To put that in context, we’re talking about the analyzed network of no more than 150 CCS2 connectors across the state. And yet, they consistently show this level of activity, hinting at a concentrated but high-intensity use of public charging infrastructure.
Figure 2 reveals an interesting pattern: in Telangana, just two districts are carrying the weight of almost the entire charging activity. Another learning is that, areas with high unavailability ratios tend to show below average charging utilization. In other words, when chargers are working, they’re often well-used.
But what about Maharashtra, India’s leader in the number of public connectors? Is it outperforming the national average, or falling short? What does its charging trend look like?
We unpack all of this here for our premium subscribers. Sign up to be a premium subscriber today!
District
Mumbai City leads with the highest charging activity of all districts covered in this analysis. Utilization stands at a healthy 33.2%, more than three times the national average. For context, this figure is based on maximum of 50 CCS2 connectors in the city.
Are you curious to know what is the utilization of Bengaluru Urban, with around 150 connectors analyzed? Or Pune, which is close behind at 125 connectors?
If you are a premium subscriber, that answer will land in your inbox next week. But if patience isn’t your thing, scroll down to section How Do I Get It Today to unlock the full breakdown today.
Metro City
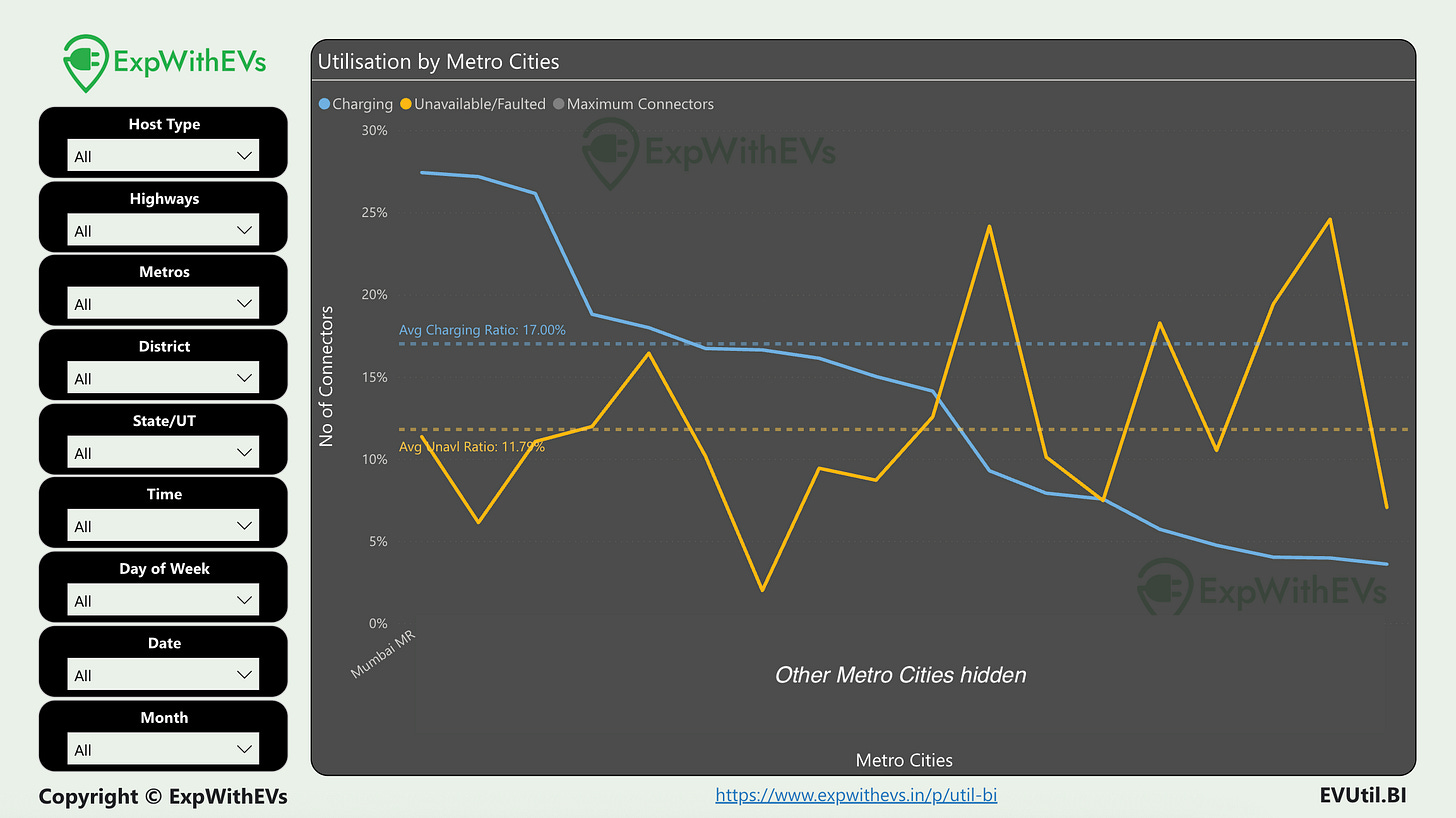
It wasn’t that surprising to see Mumbai Metropolitan Region topping the metro cities. Delhi NCR or Bengaluru could’ve been the other two contenders. The utilization is at a robust ~27%, i.e. one in four chargers analyzed in this report are dispensing energy.
Mumbai MR includes Mumbai City, Mumbai Suburban, Thane, Navi Mumbai and Palghar districts.
Here’s a fun challenge: Can you guess which other metro city comes close to matching Mumbai MR’s utilization? Drop your answer in the comments. The first correct entry will win a free month of premium membership!
Premium subscribers will get the breakdown and detailed comparisons in next week’s article.
Coming next week for our premium subscribers :
Charging percentages for Bengaluru Urban and Pune
Time of Day trends for the second-best performing metro city
Two Indian highways with utilization + ToD analysis
The role of nearby amenities in influencing charger usage
States with the highest and lowest estimated energy dispensed
Our national estimate of energy delivered via public chargers
A detailed utilization map of …. ?
It’s a very good week to be a premium subscriber, and an even better one to become one, if you aren’t already.
How Do I Get It Today
You can now access this data through two powerful products launching today:
✅ EVUtilBI - the interactive PowerBI tool
Peek into India’s EV charging behaviour.
With EVUtilBI, you don’t just look at data, you explore it. Slice and filter real-time patterns across geographies, time, and charger types to uncover actionable insights tailored to your needs.
Key Features
Time of Day (ToD) Patterns: By state, metro, or host type
Utilization Maps: From state → district
Utilization charts: By highways, State, District, Metro, Days, Dates, Months, Host Type
Custom Filters: Zoom into CCS2 chargers in malls on NH48 on weekends in May? Done.
Date-Specific Insights: Charging trends in Etawah district at 5 AM on 6th May 2025? It’s here.
Intelligence Pages: Automatically ranks top and bottom performers by utilization.
If you're a decision-maker at a CPO or government agency, this tool gives you what no one else can. Clarity and context, in seconds.
Special Launch Offer:
Customers who sign up before 30th June get:
25% discount
Free June 2025 update → That’s three months of insights for the price of two.
Premium subscribers get until 10th July to avail this offer.
Ready to unlock this? Reach out today, and we’ll onboard your team.
(Special pricing available for CPOs.)
📄2505 Utilization Executive Summary (PDF)
For when you need a ready reference or snapshot benchmark.
Prefer a static summary you can present or archive? This PDF report compiles the key highlights from our dataset into a clean, powerful document you can keep on hand.
What’s Inside
State-wise Utilization and Rankings
Top 30 Districts by Utilization
Top 2 Highways
ToD Breakdown for States and Metro Cities
Top 10 Districts with Highest Non-Working %
Ideal for teams needing a clear benchmark or for sharing quick insights with leadership.
Bonus for Annual Premium Subscribers:
Buy the PDF by 25th June and get the June 2025 update free in July.
(Standard buyers do not receive the update.)
The price will increase after 25th June, which will include June 2025 data.
Here is the document detailing our terms and conditions, measurement techniques, data caveats, disclaimers, disclosures, etc.
All rights reserved with Priyans Murarka @ ExpWithEVs.
The data from here and this article cannot be repackaged or sold without explicit written permission of ExpWithEVs.


