
2506 EV Infra BI
Tracking EV Charging Infrastructure minutely


We are excited to publish the fourth update to EVInfraBI! If you are unfamiliar with EVInfraBI - it is the first ever charger intelligence tool in India. We map out the entire charging infrastructure in India, from charger locations to rating, costs, hosts, proximity to highway and a lot more.
To go into more details, you can read our previous versions here.
Sep 2024, Dec 2024 and Mar 2025.
ICYMI, last week, we released the Trends for EV Charging infrastructure as of June 2025.
Annual premium subscribers to this blog will be able to request a 24h access to this PowerBI instantly. Monthly subscribers can request for any chart of their choosing from the report. More details here.
We had a fruitful visit to Hong Kong and great interaction with folks attending the EVReporter’s event. A detailed article about our Hong Kong visit will be published soon.
It is a good time to be a paid subscriber if you aren’t already. Psst, we have added a new plan “I <3 Independent Analyst” that allows 7 days customized access to our premium tools! Check it out.
Group subscriptions are also now enabled and eligible for discounts! Perfect for teams in an organization.
Let’s dig in
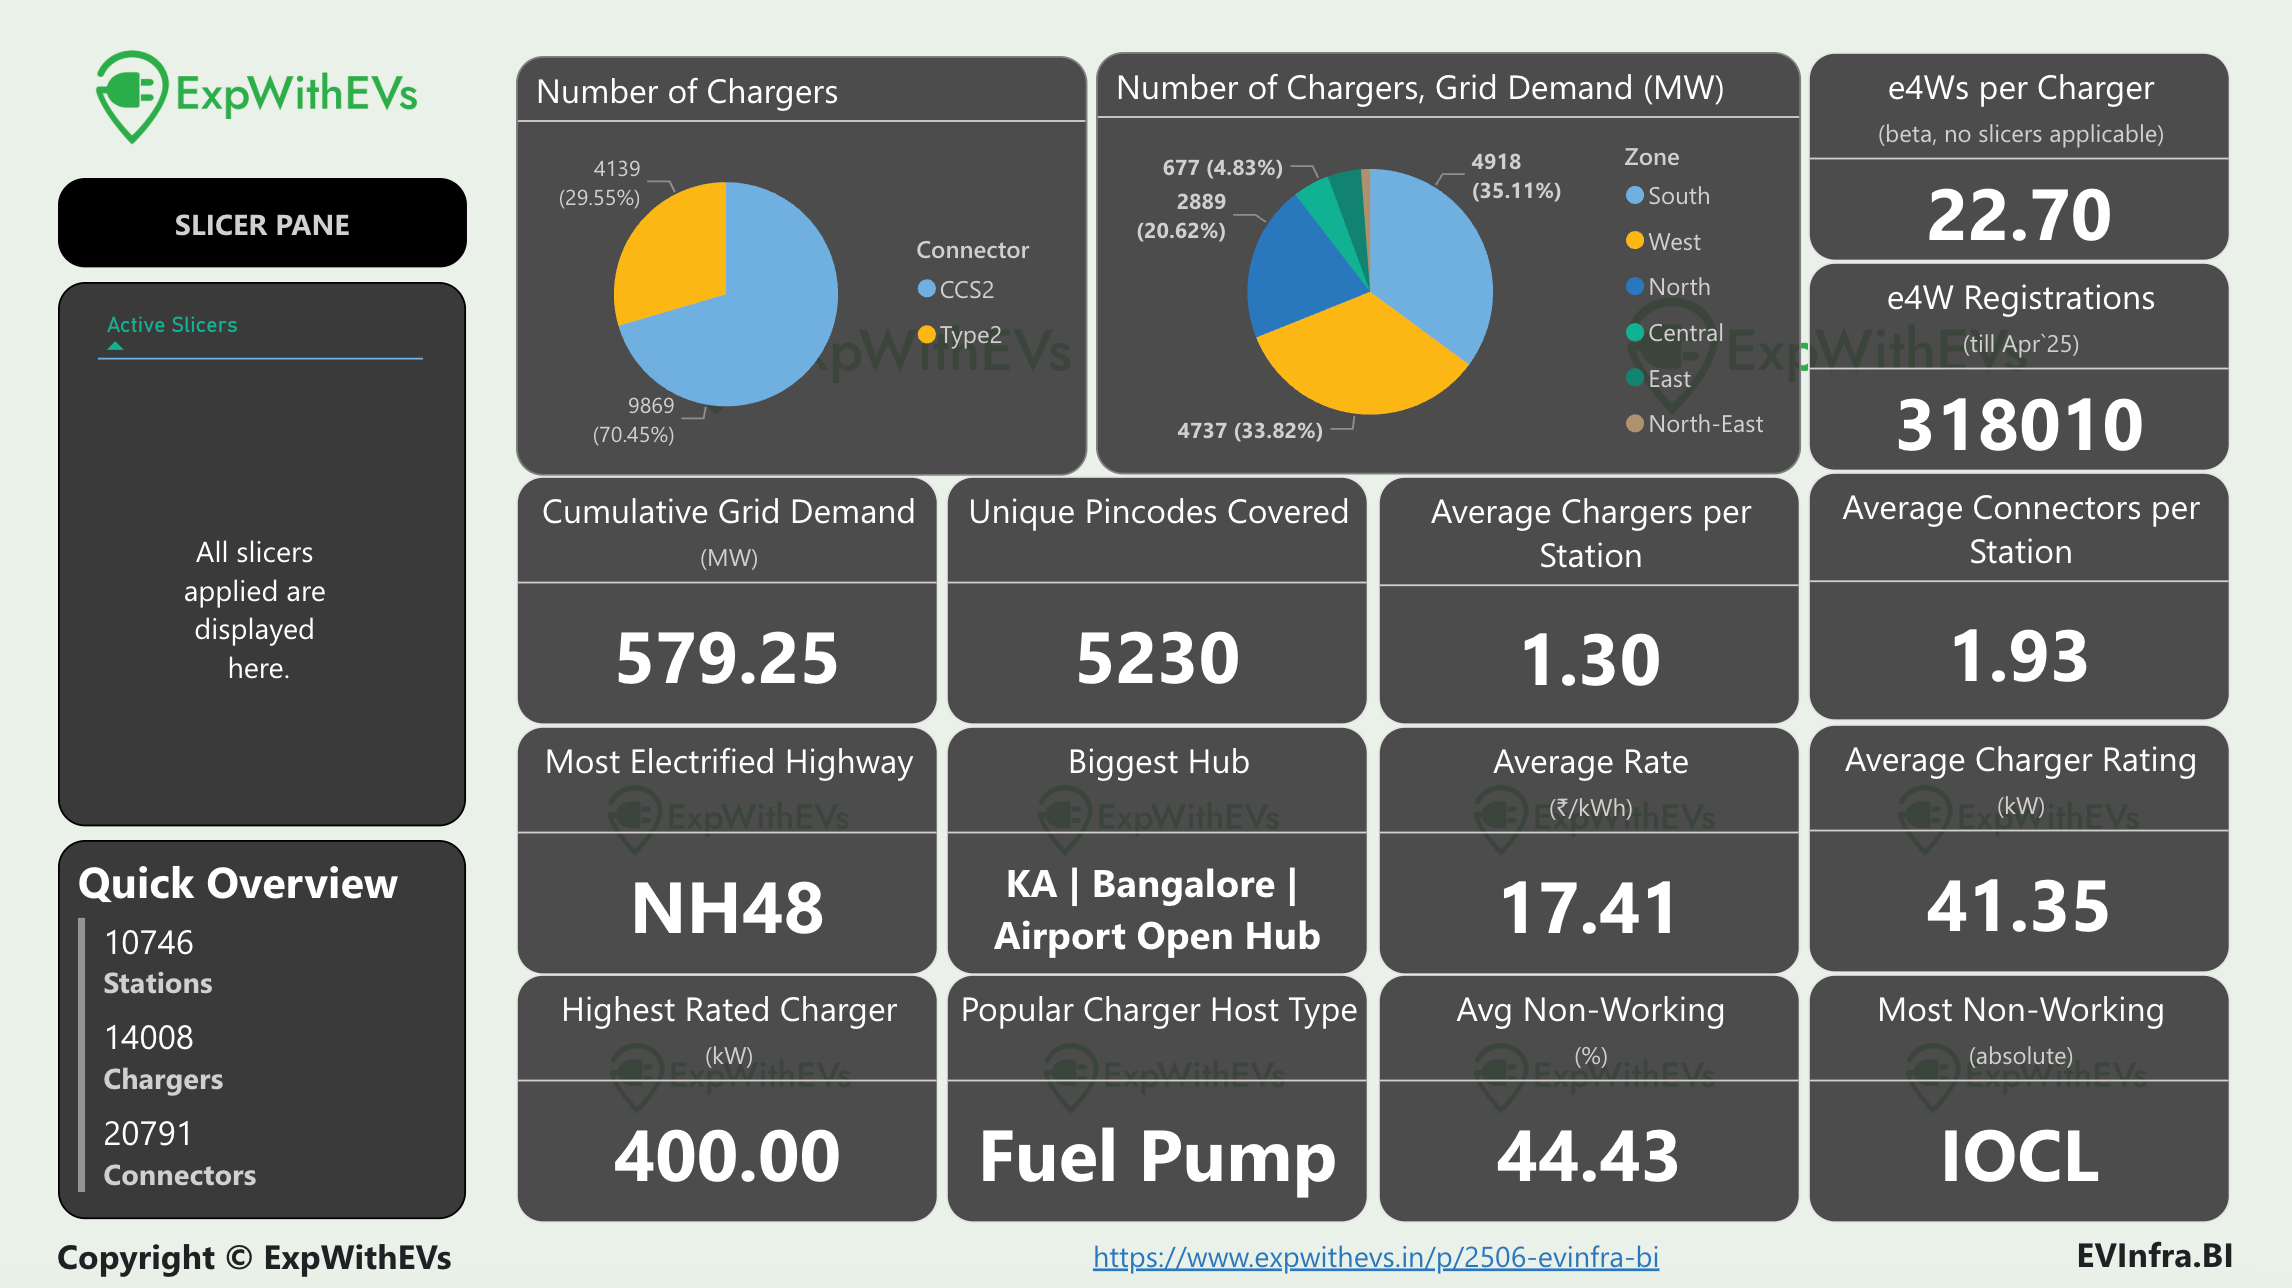
We are at ~14000 chargers - CCS2 and Type2. The ratio has remained similar of CCS2 to Type2. South, West and North make up close to 90% of the charging infrastructure in India.
The grid demand is roughly at 580MW of public EV charging. It is ~0.12% of India’s installed power generation capacity, as per Executive Summary Report in May 2025 by Central Electricity Authority, India. The grid demand went up by over 25% from the previous quarter, whereas the chargers went up by only 20%. This resulted in the average charger rating to go up by ~7%.
The geographical spread of chargers also increased by ~12% from the previous quarter. The average cost of charging also went up by INR 1.2 (US$0.01) per kWh. Unfortunately, the percentage of non working chargers also went up significantly by ~8% to 44.43%.
The biggest hub title has been snatched by ChargeZone’s 5.6MW Bengaluru Airport Hub from Glida’s 2.3MW Hyderabad airport hub. There’s more to this story for our premium subscribers.
The average connectors per charging station is 1.93, indicating that majority of EV charging stations in India are a dual gun charger or two single gun chargers. This gets further reinforced by average chargers per charging station, which is 1.3, signalling a higher count of a single charger dual gun setup.
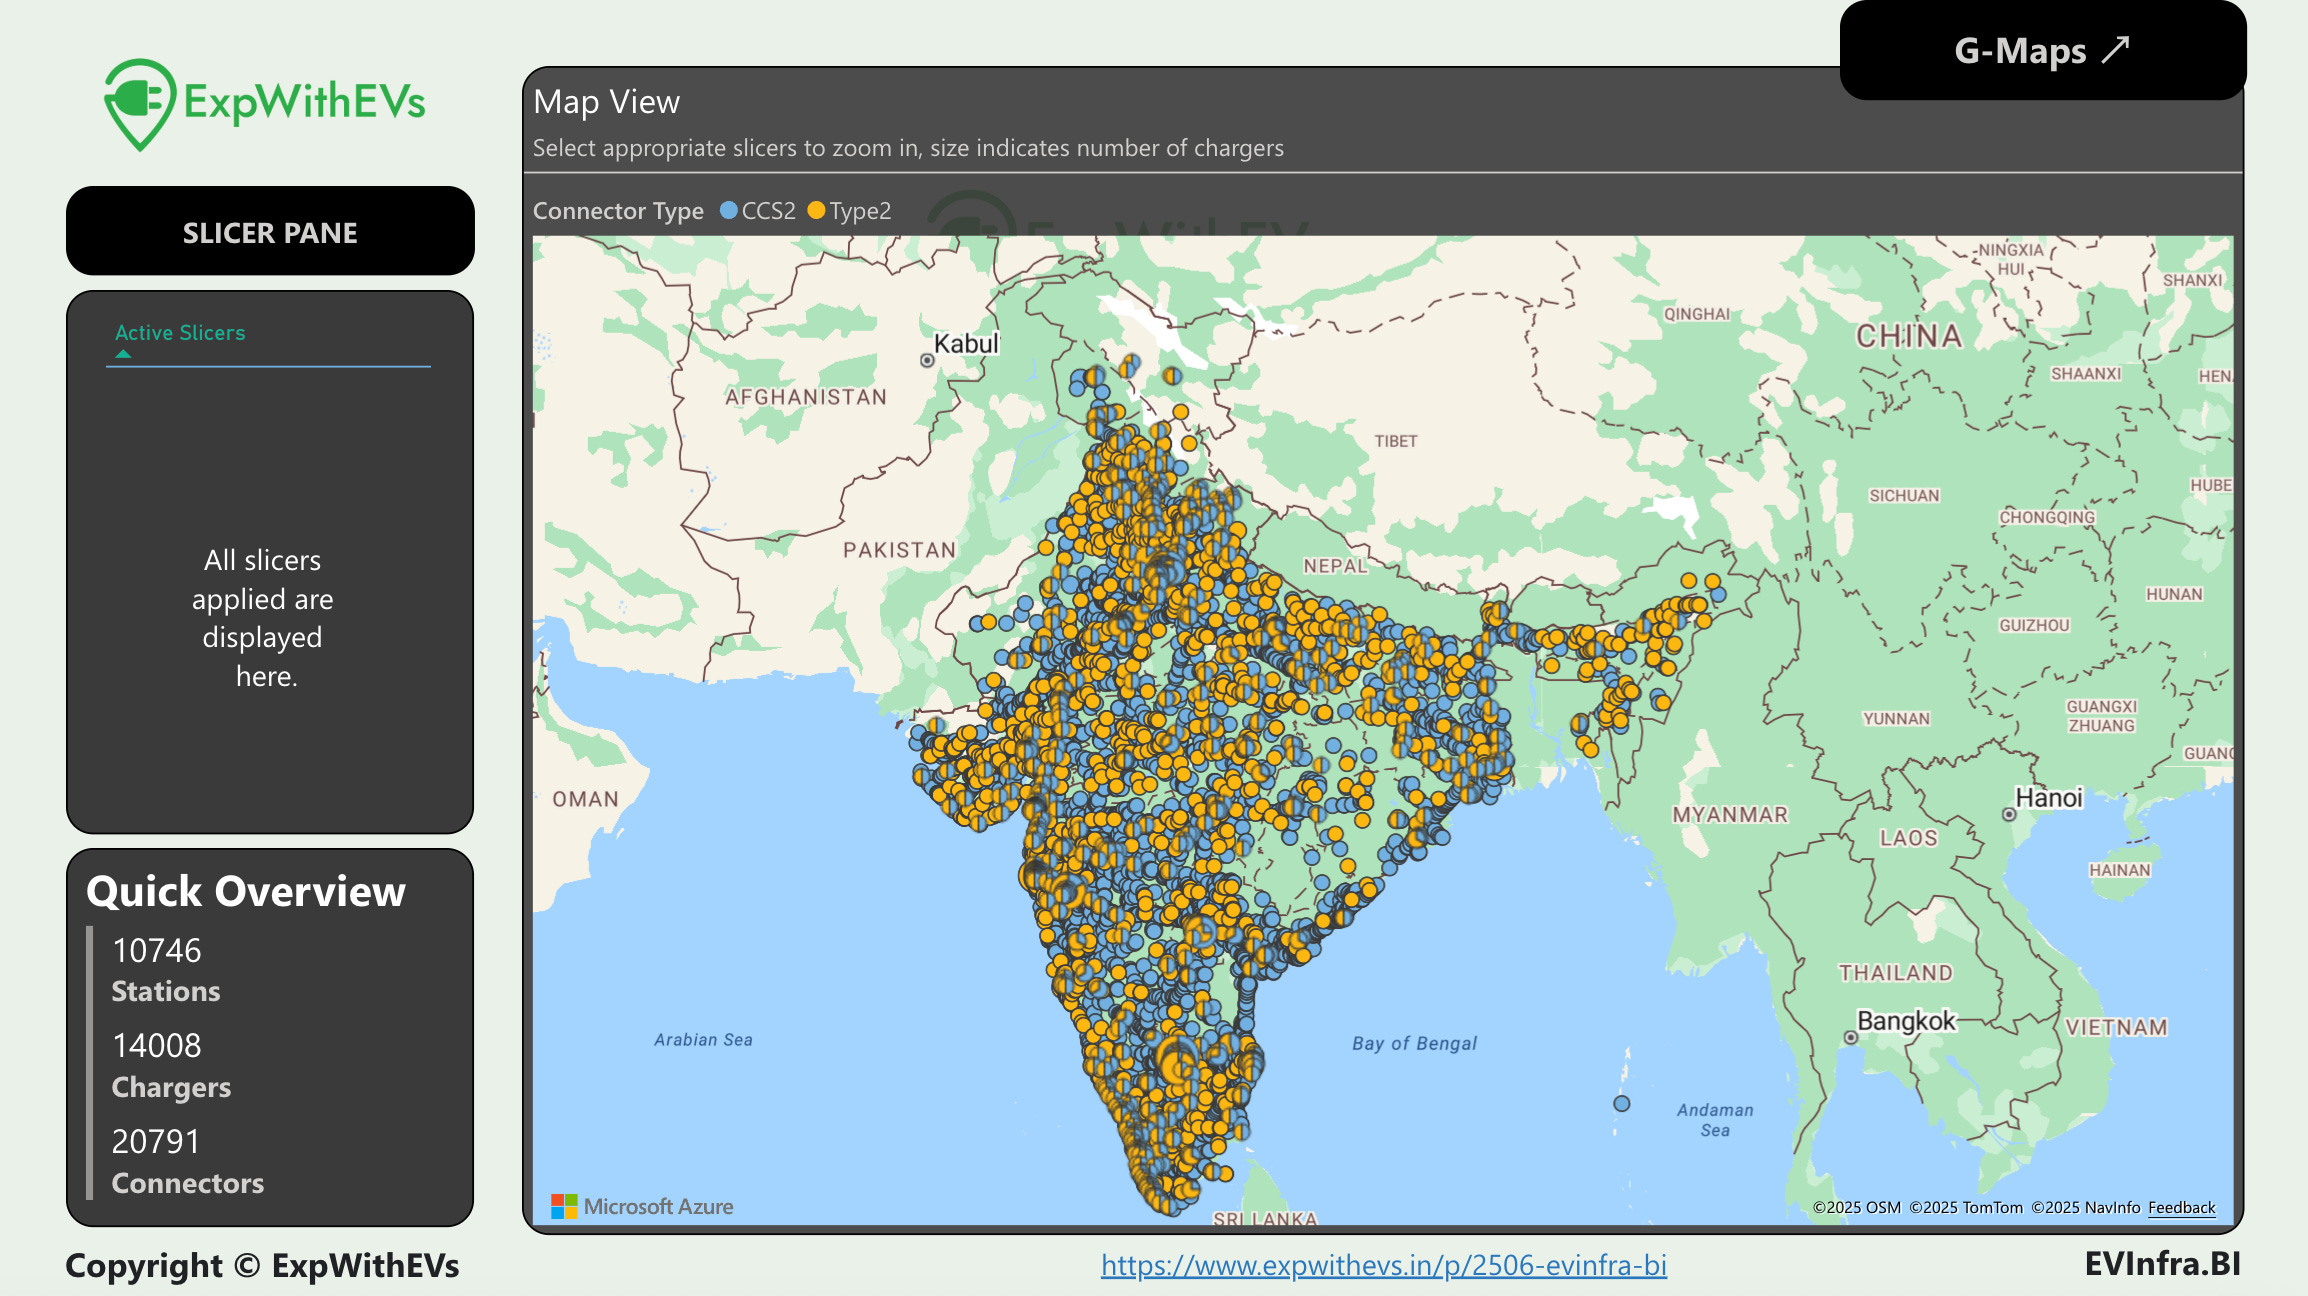
You can show someone this image to show how widespread and dense the charging infrastructure is, in the country. The south, west, north, gangetic plains, coastal regions are dotted with chargers.
Now, annual EVInfraBI users can select a charger to go to the exact location on Google Maps by the top right button titled G-Maps.
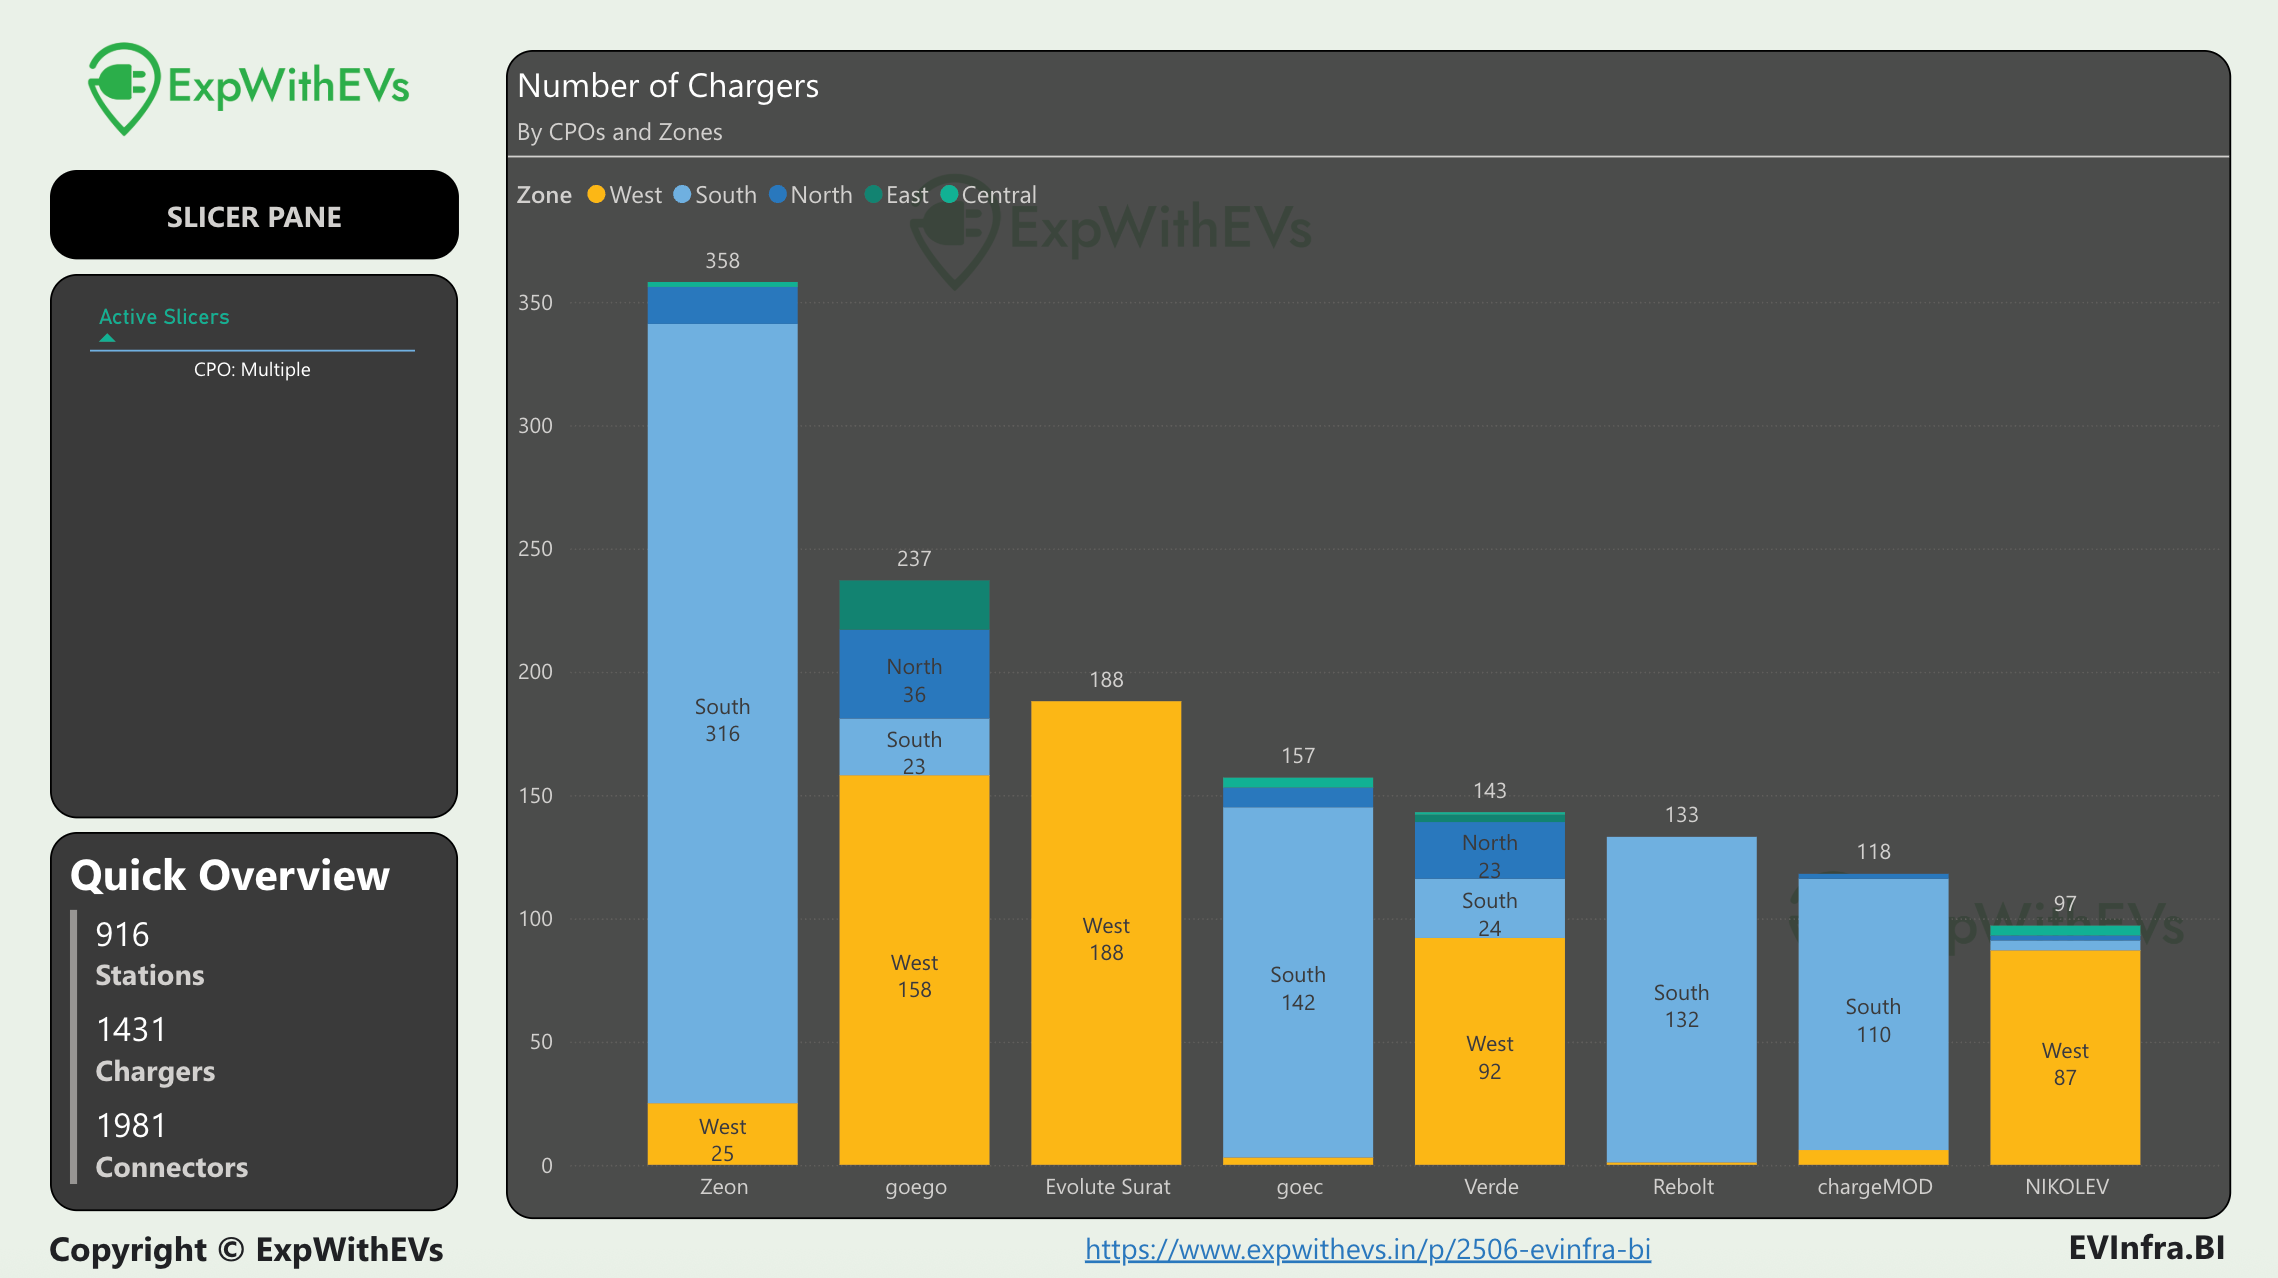
We take a look at certain CPOs having dominance in one particular zone with 100 or more chargers. We refer to them as moderately sized regional CPOs. In our Sep 2022 report, we spoke about how going deep is a better strategy than going wide atleast for starters.
Regionally dominance makes it convenient for customers. A user can rely on a certain CPO in a certain region. They prefer same brand of charging station after every positive charging experience. A regional brand understands the nuances better, can support in regional language and is likely lighter on liabilities due to lean operations.
Premium subscribers can study average power ratings and the average cost of charge across CPOs later in the article. We also talk about TataEV’s chargers via partner CPOs and share some spicy information we dug up.
Non Working
CCS2
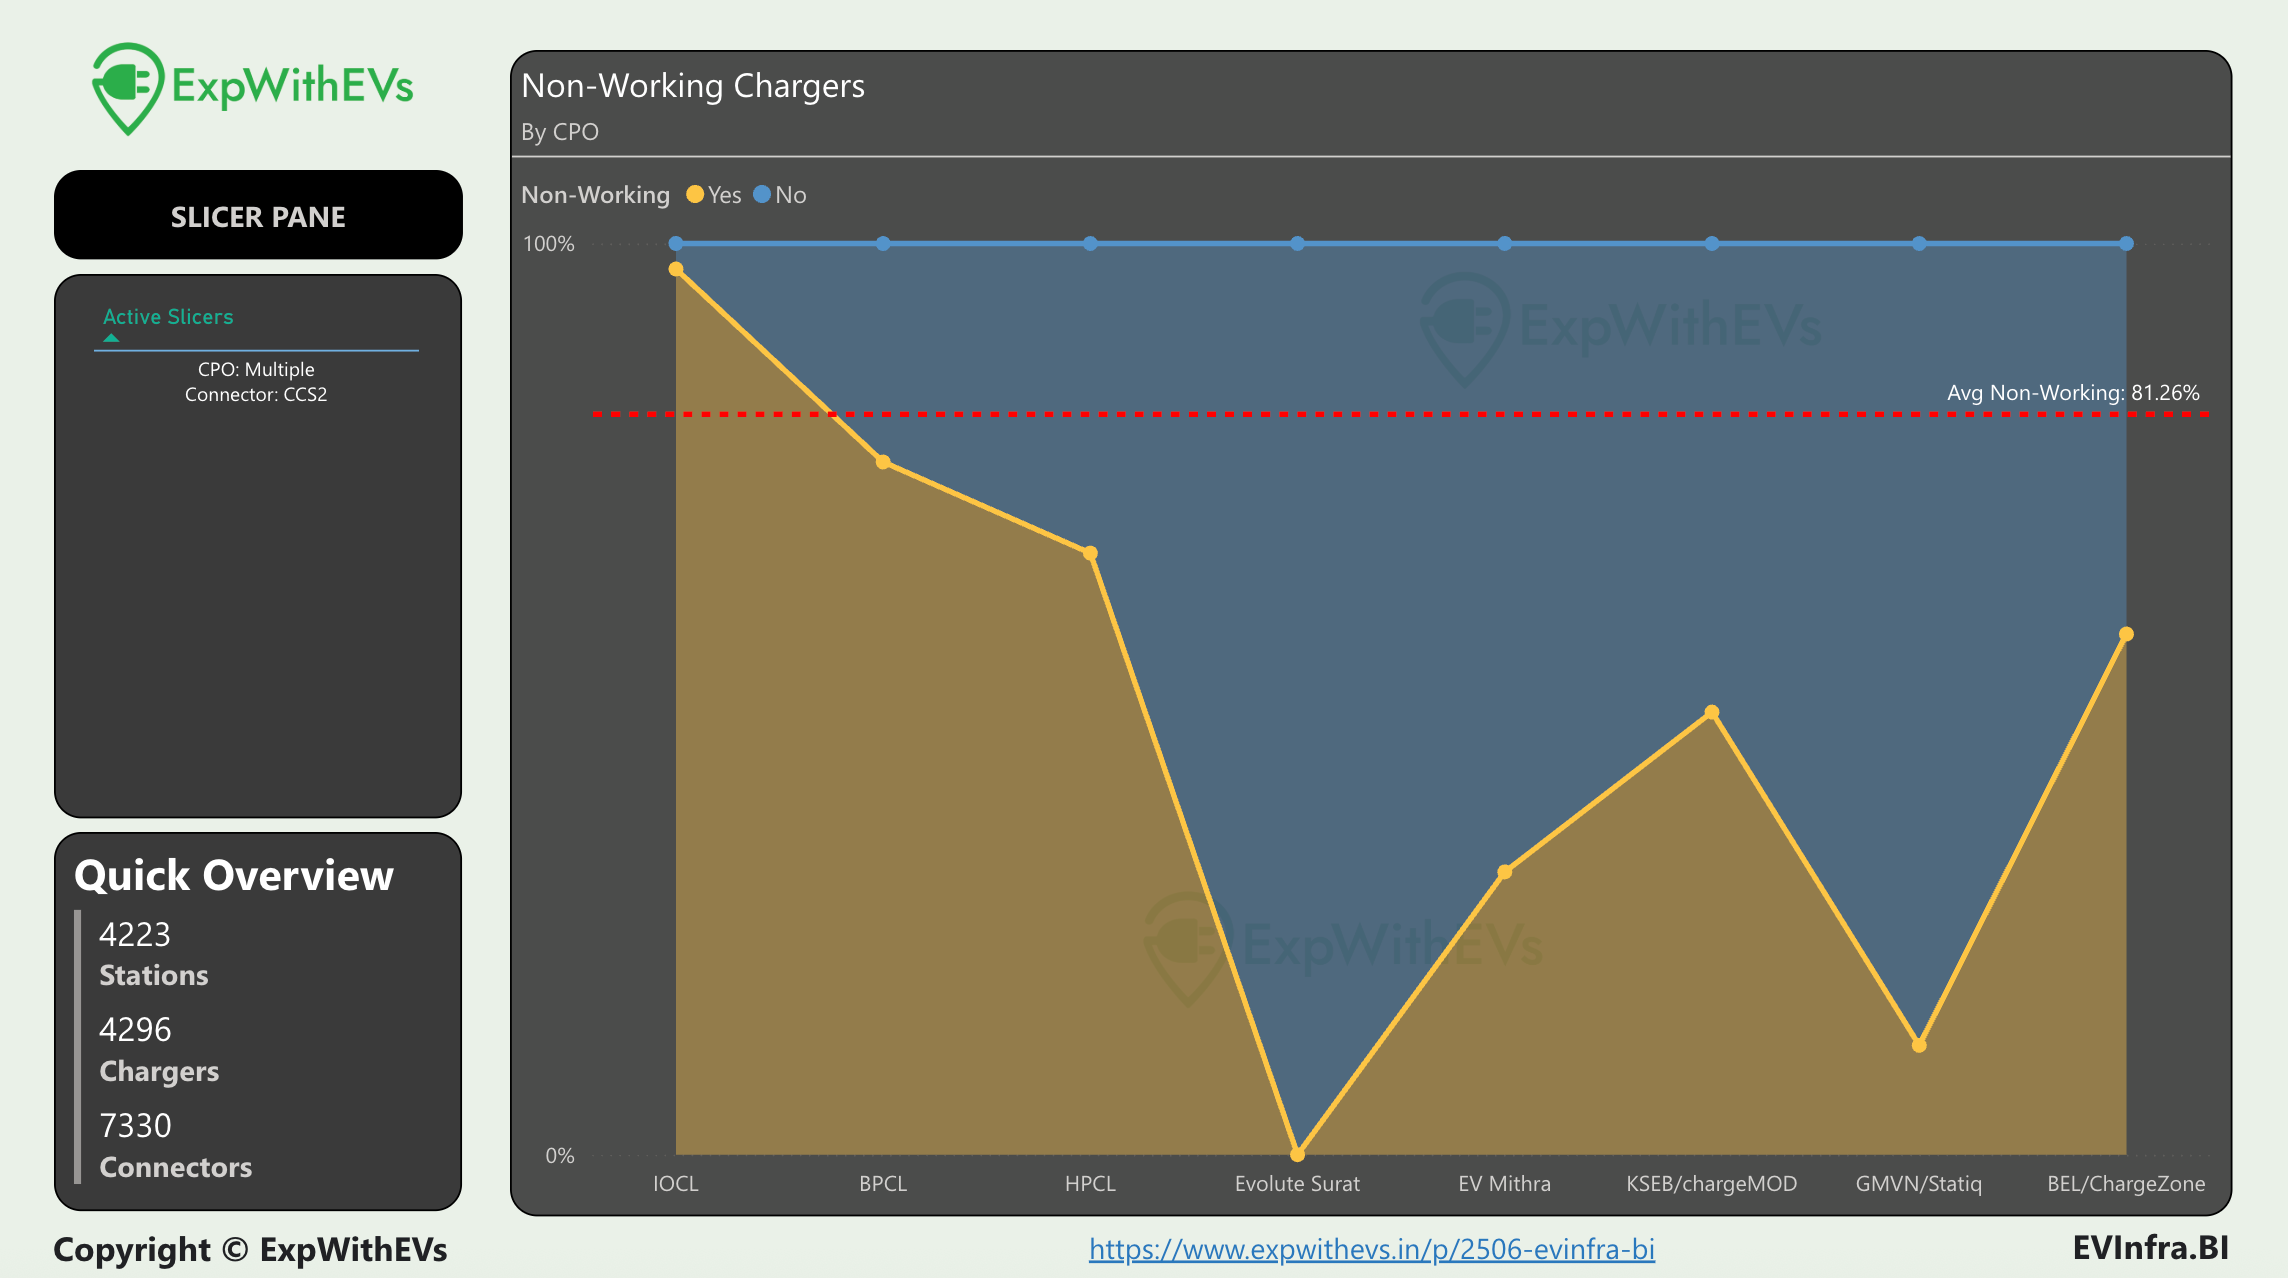
Of the 4296 CCS2 chargers operated by public entities, 81.26% were found to be not working (~ 3491 chargers). IOCL is responsible for more than half of non working CCS2 chargers in India.
BPCL is the second on this list. Both, IOCL and BPCL, are leading in setting up 120kW chargers. Just setting up infrastructure is a job half done. Making it operational is equally challenging. I wrote more about their expansion to 120kW chargers here.
We discuss state of top private CPOs for our premium subscribers later in this article.
Type2
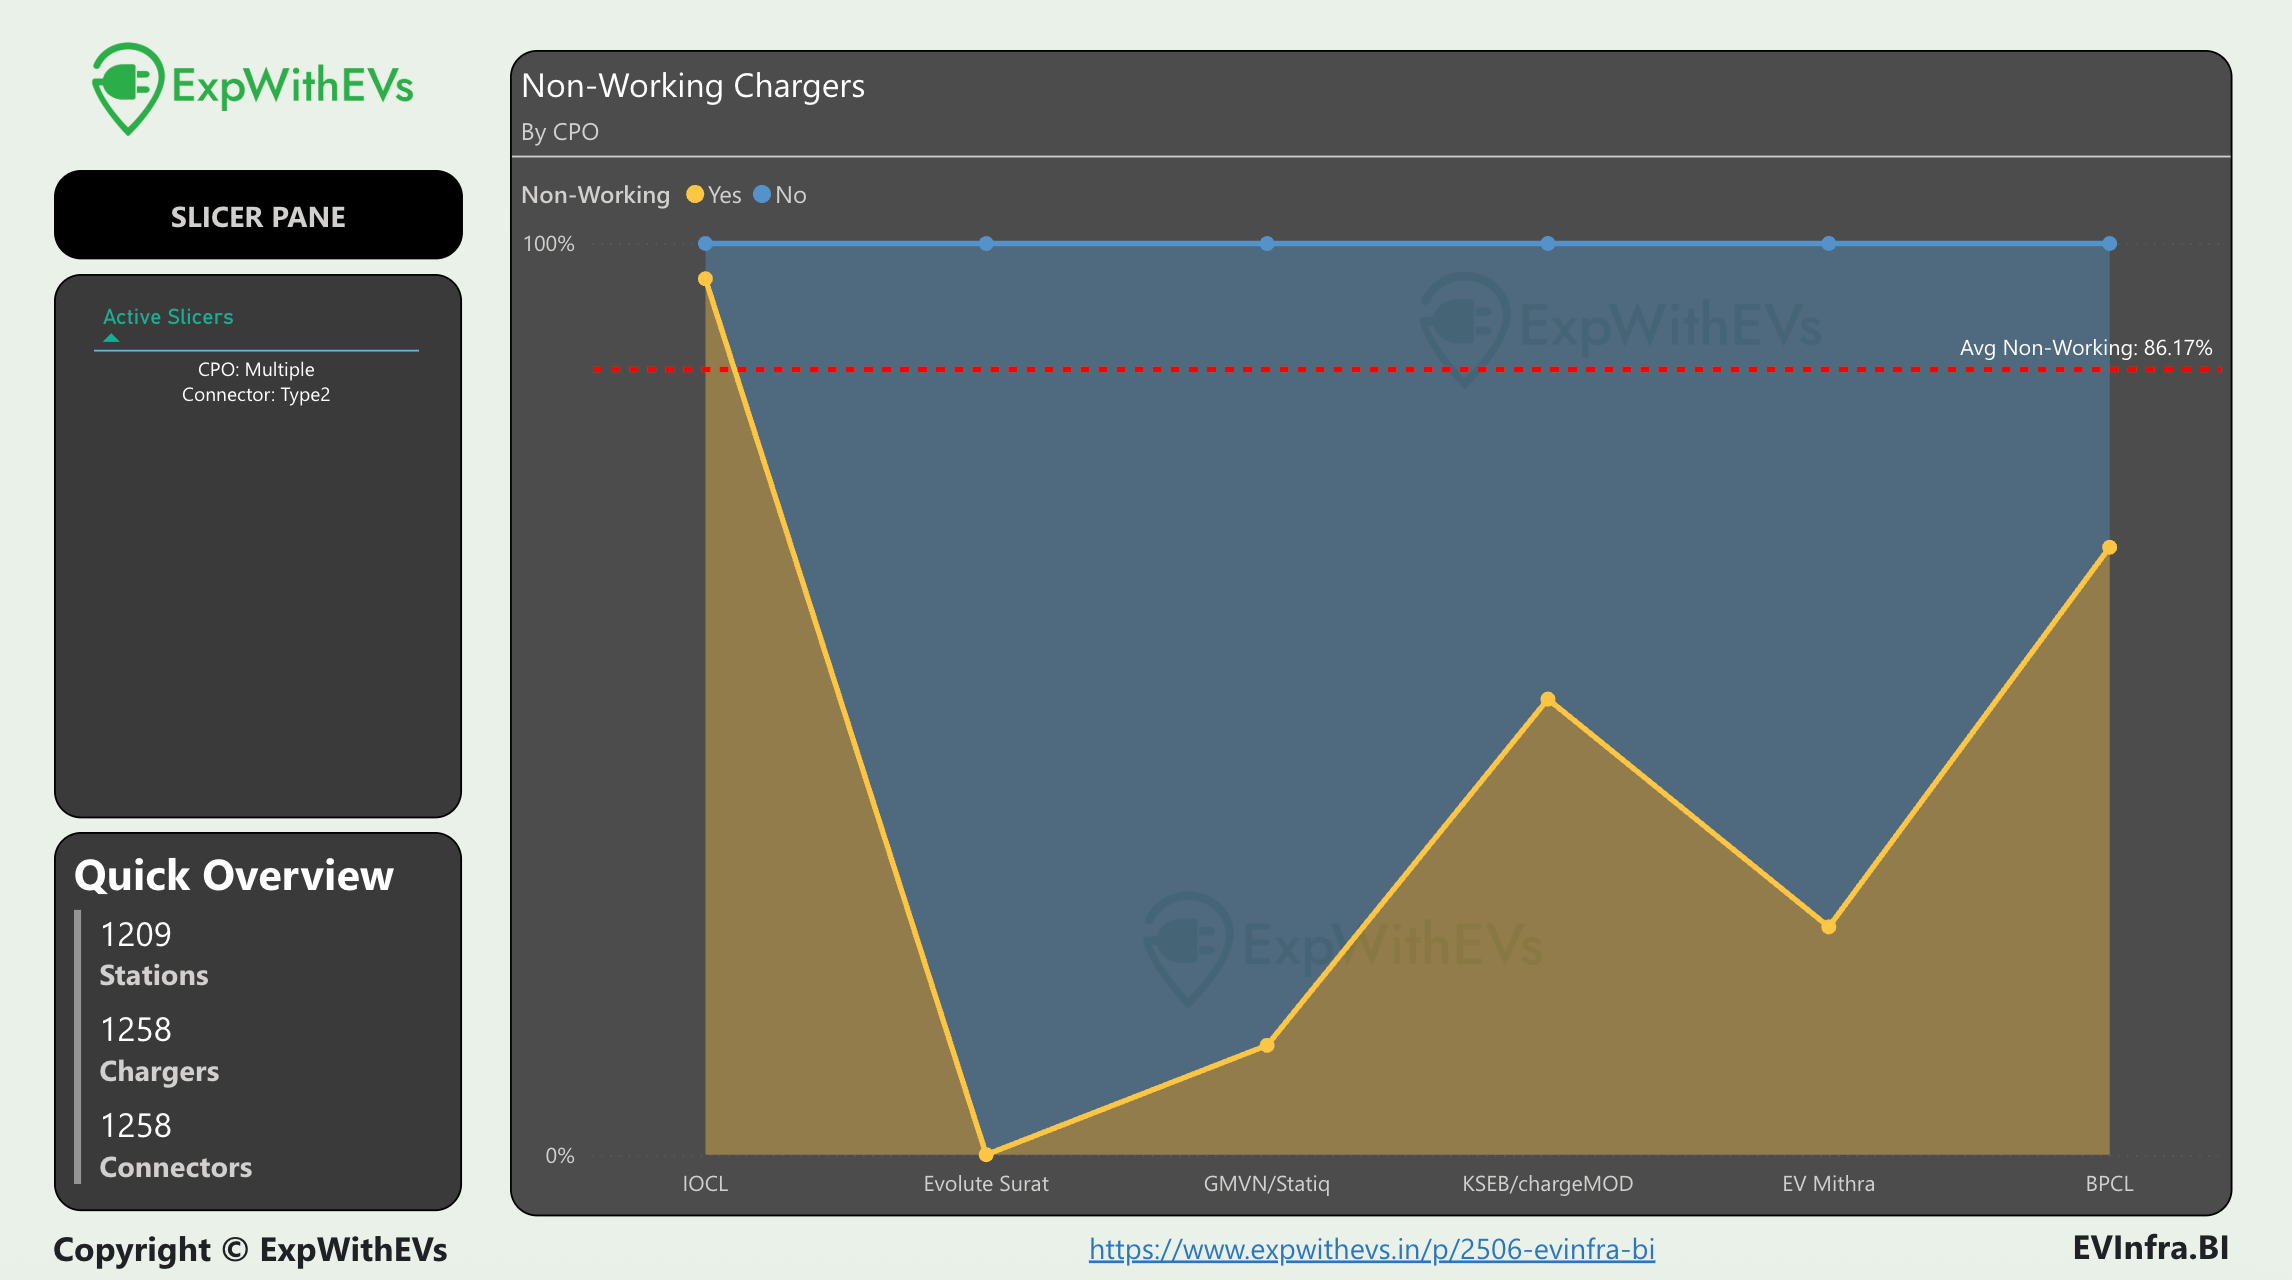
There are roughly 1250 Type2 chargers across public infrastructure, of which, 86% were found to be not working in our study. IOCL hosts almost all non working public Type2 chargers. Only eight non working Type2 chargers by public entities are spread across the rest of public CPOs.
If you know someone at IOCL, or if you are a vendor to IOCL, I would love to chat with you. Please drop me a message.
Some of the private players’ Type2 charging infrastructure isn’t doing well either. Following CPOs, with atleast 10 Type2 chargers, had more than half of their network offline — Bijlify (~69%), PlugEasy (~64%), Verde (~66%), Sunfuel (~75%), NikolEV (~56%), EVRE (~74%), Kurrent (~59%), LionCharge (~67%) and Volt Panda (~86%).
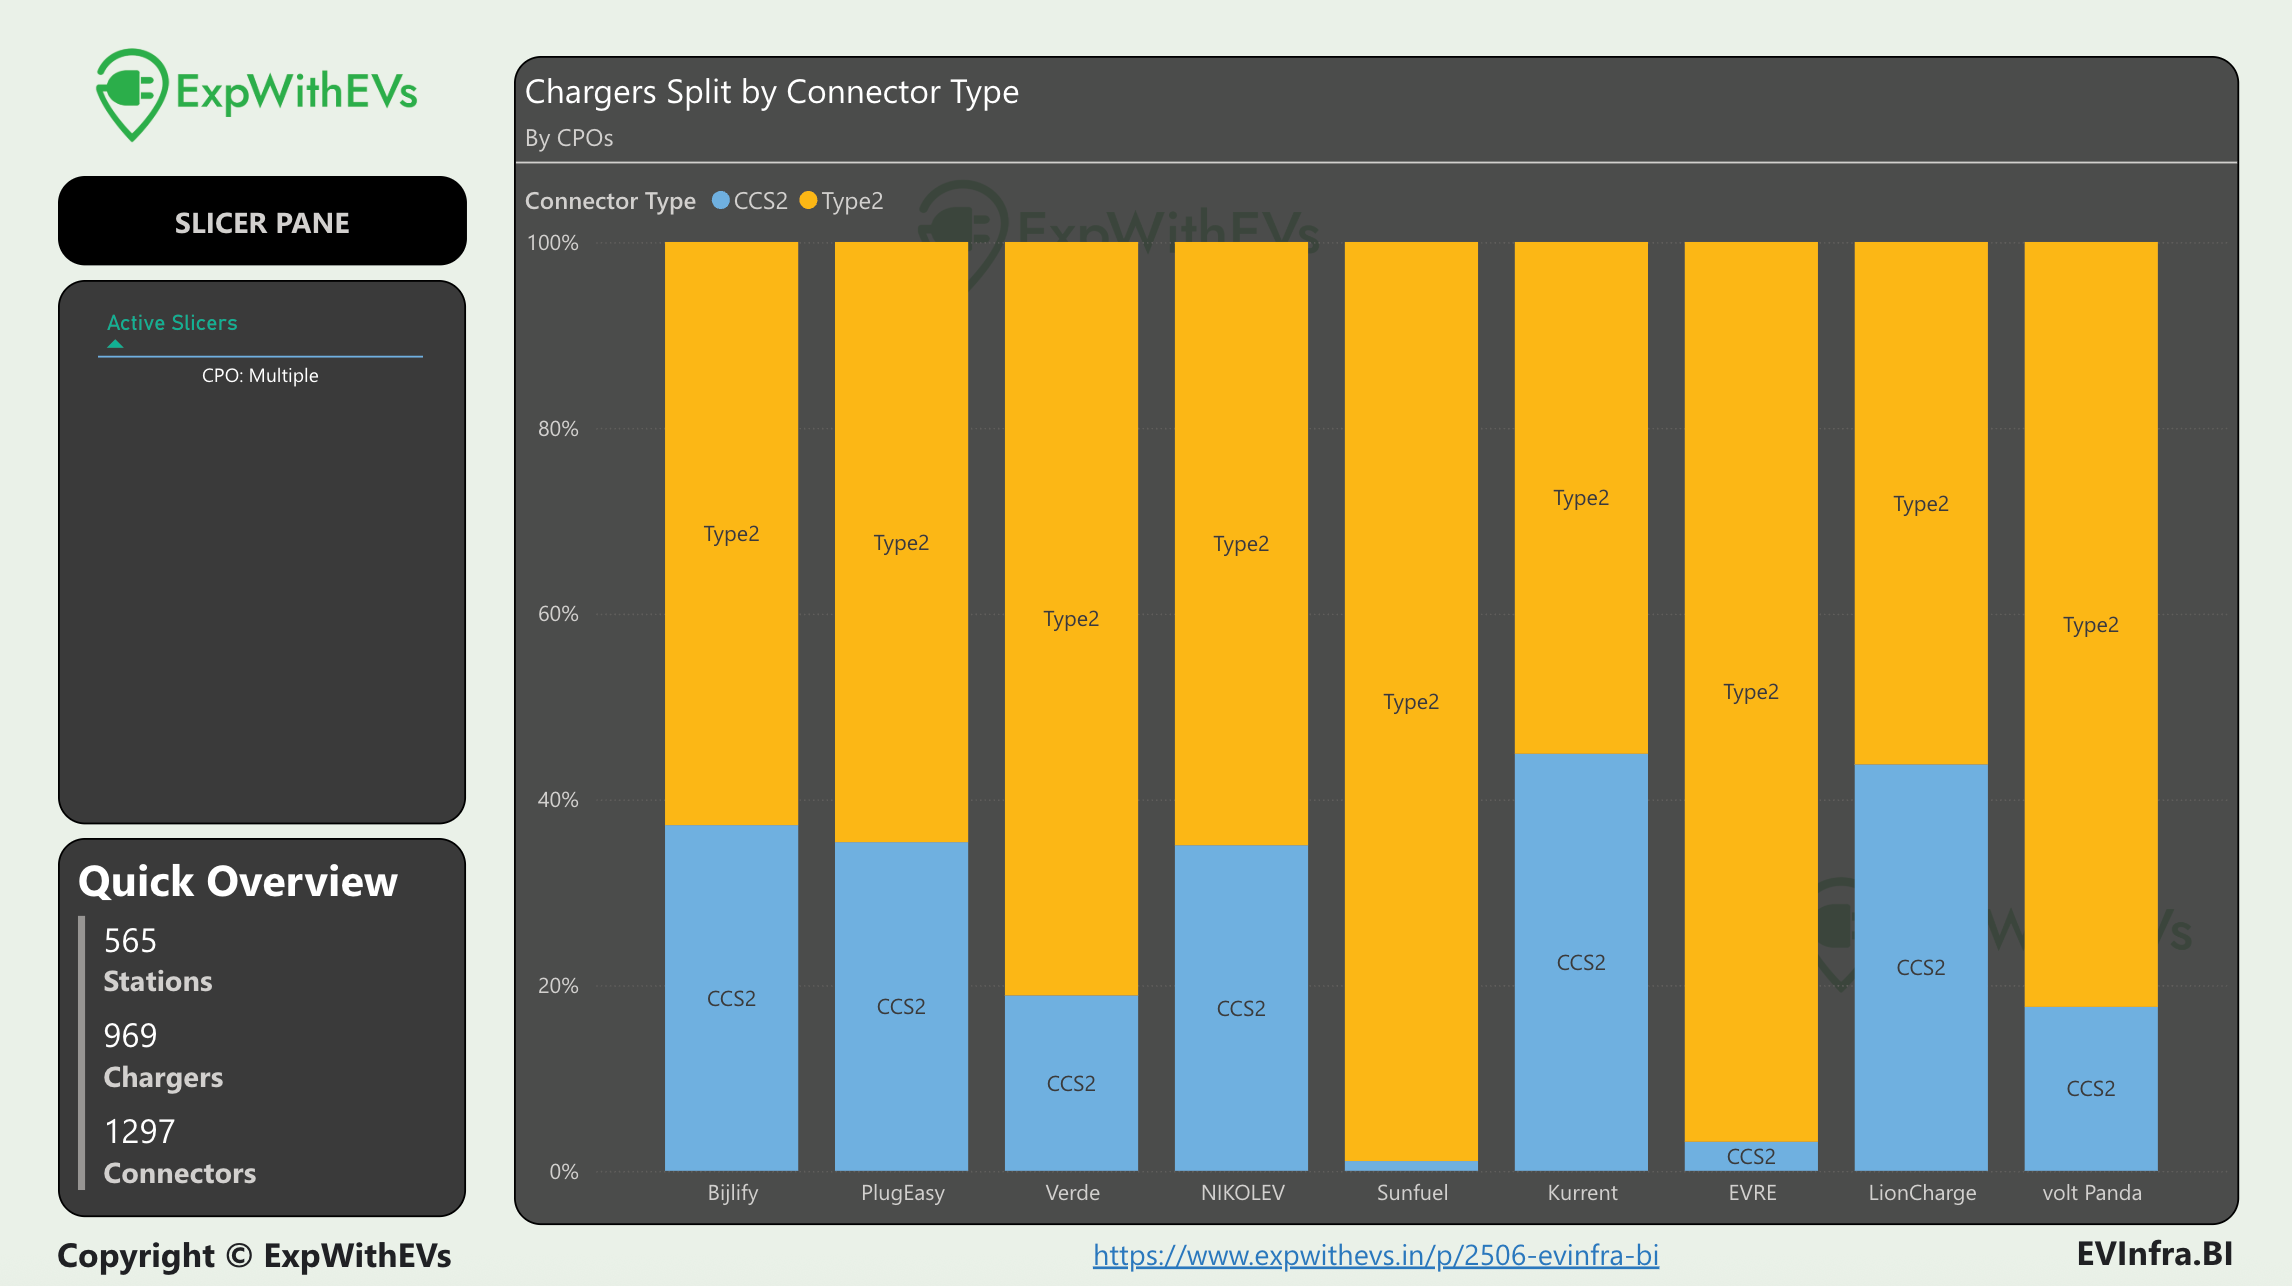
All these CPOs are Type2 dominant, especially SunFuel, EVRE and Verde. It is likely that public EV charging may not be the primary business for these companies, but if it is, then I don’t know why or how they are still in business.
Highway Proximity
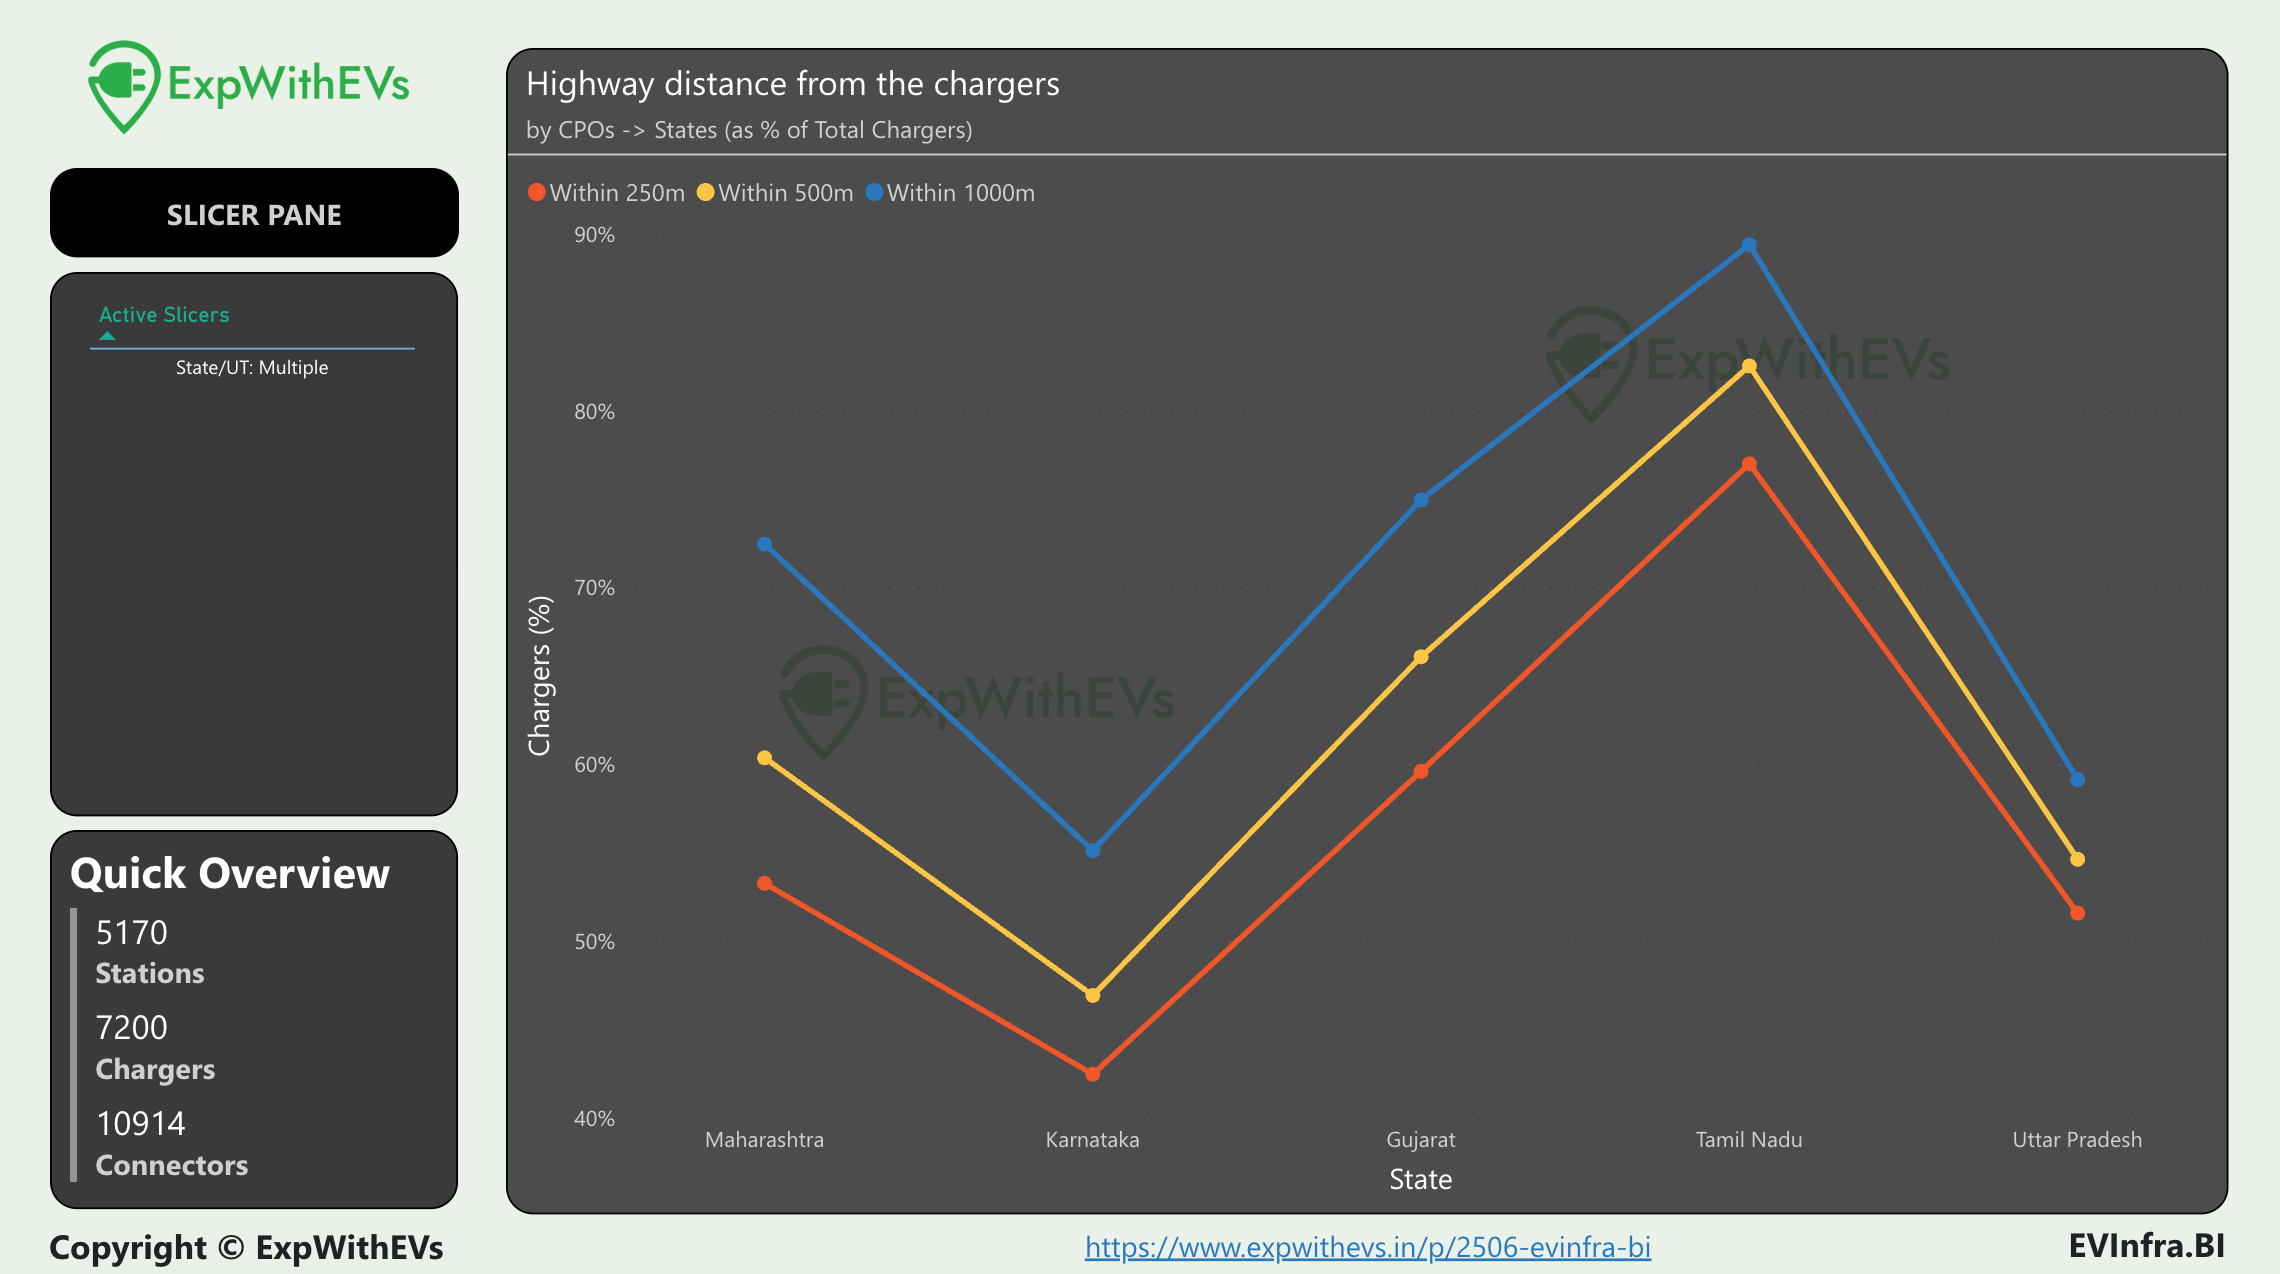
Among the top five states, Tamil Nadu has the most number of chargers located near highways, with approximately 90% are within 1 km of a highway. This is an excellent metric to show that the chargers are spread across the state, enabling for e-mobility between cities.
For our premium customers, we will look at 60kW CCS2 chargers within highway proximity for commercial use cases.
We will also showcase a new chart for our premium subscribers, where we display average chargers and average connectors per station. We will discuss some top players.
Metros
In this section we will highlight which metros come at the top of the list for non working chargers.
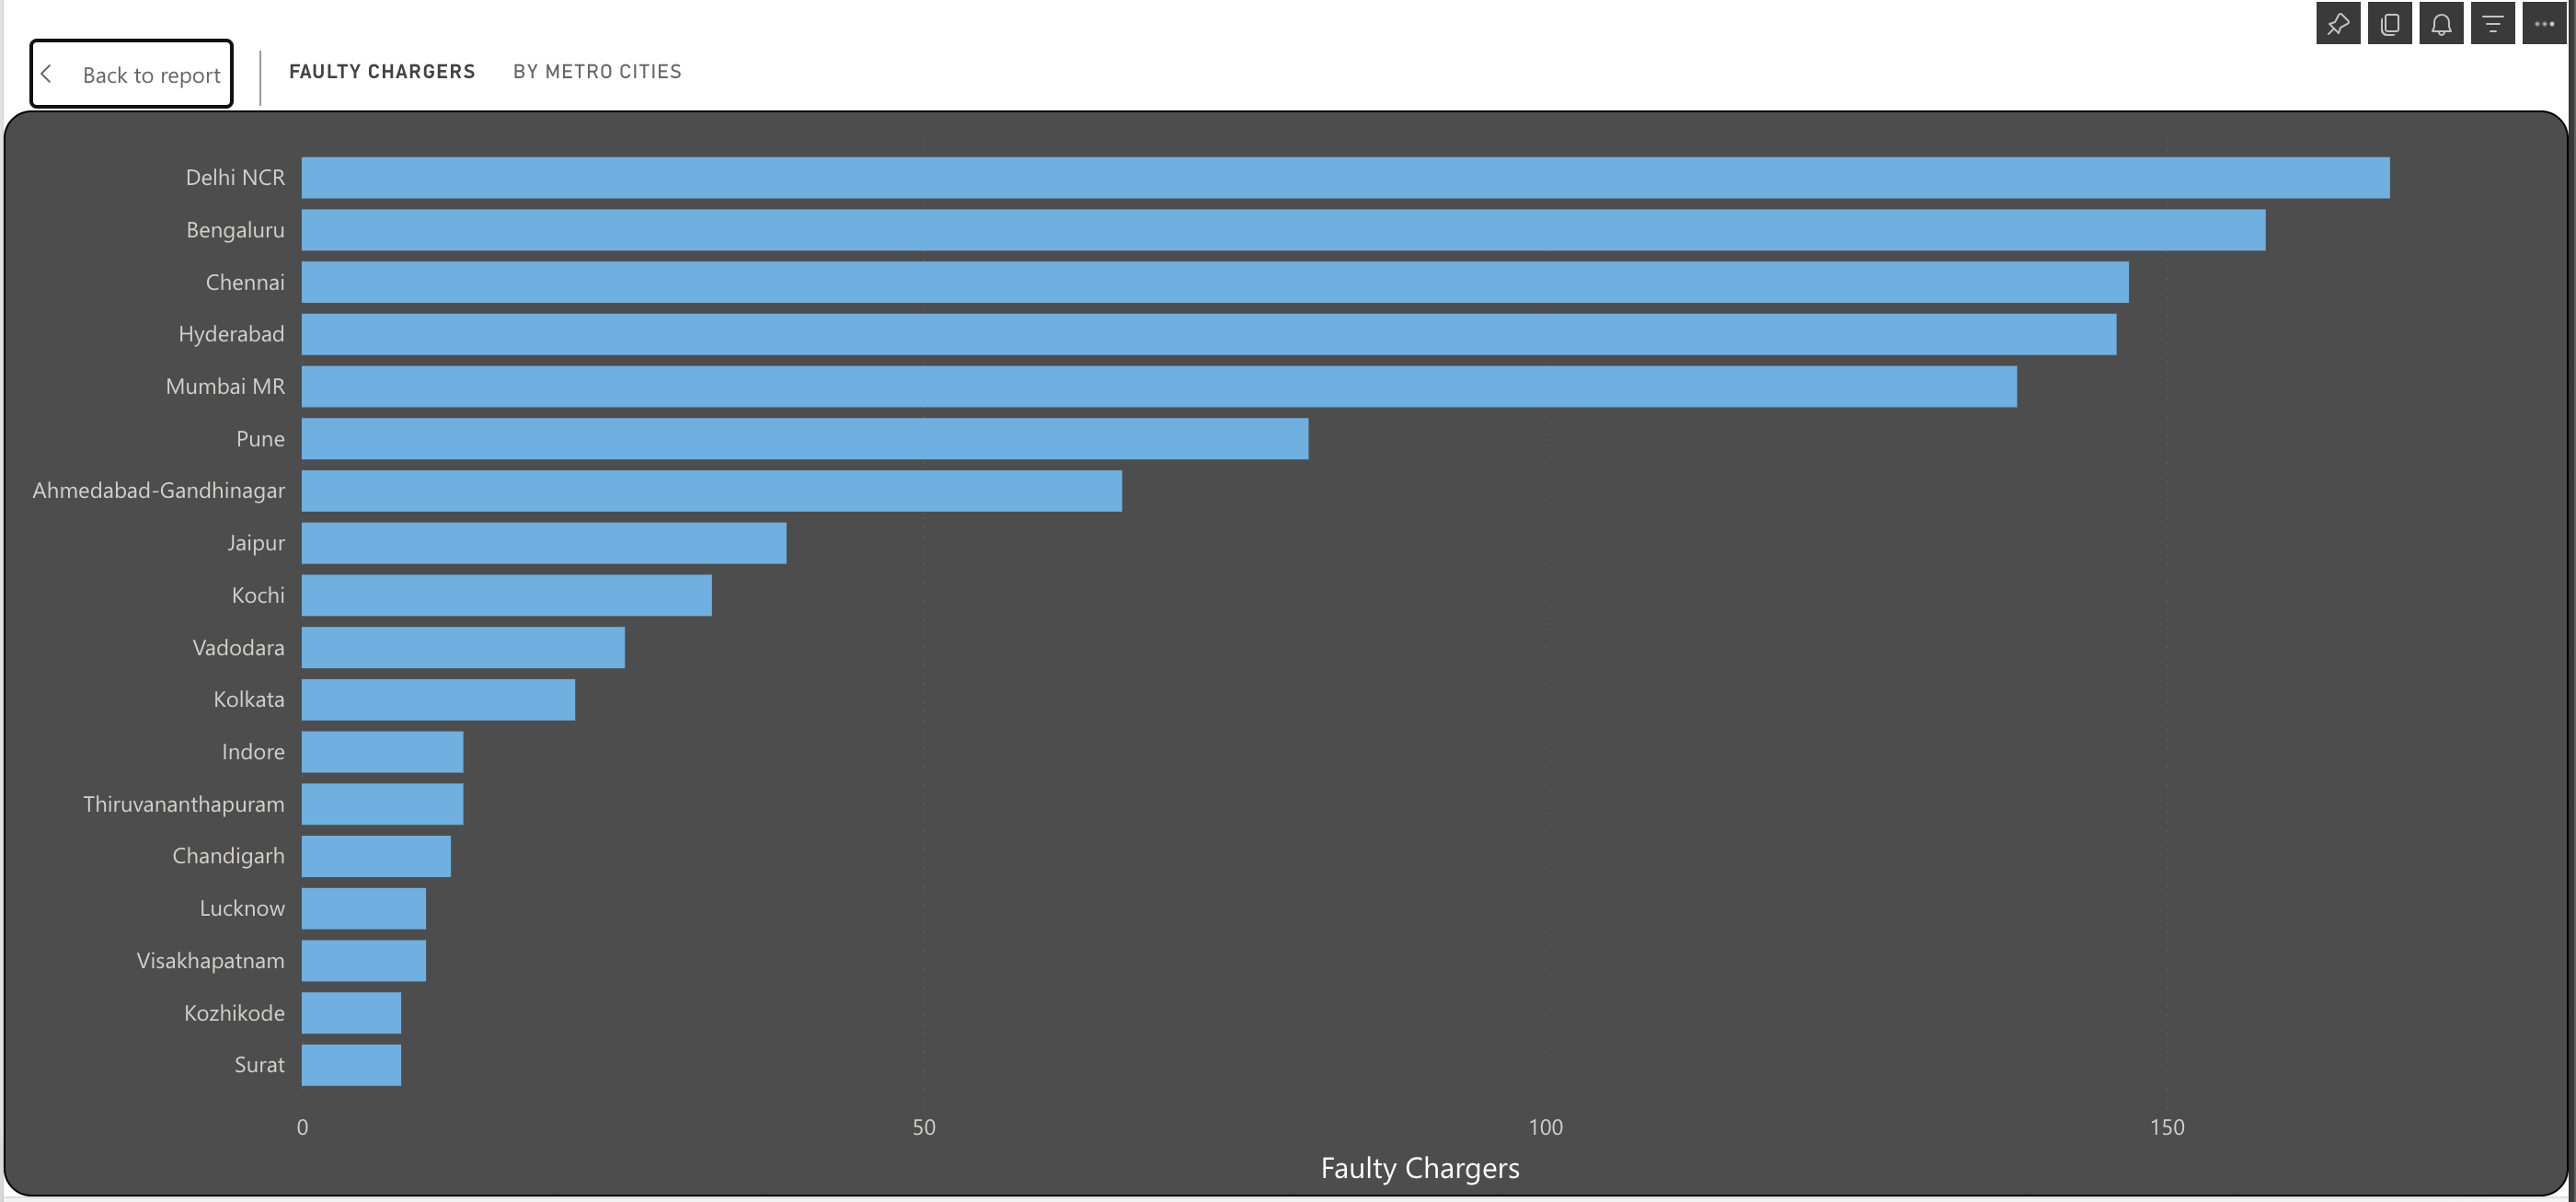
Delhi NCR narrowly leads this infamous list. Bengaluru is next with over 150 non working chargers.
We know that the major culprits of non working chargers are public sector oil companies. Let us see what happens when we remove them.
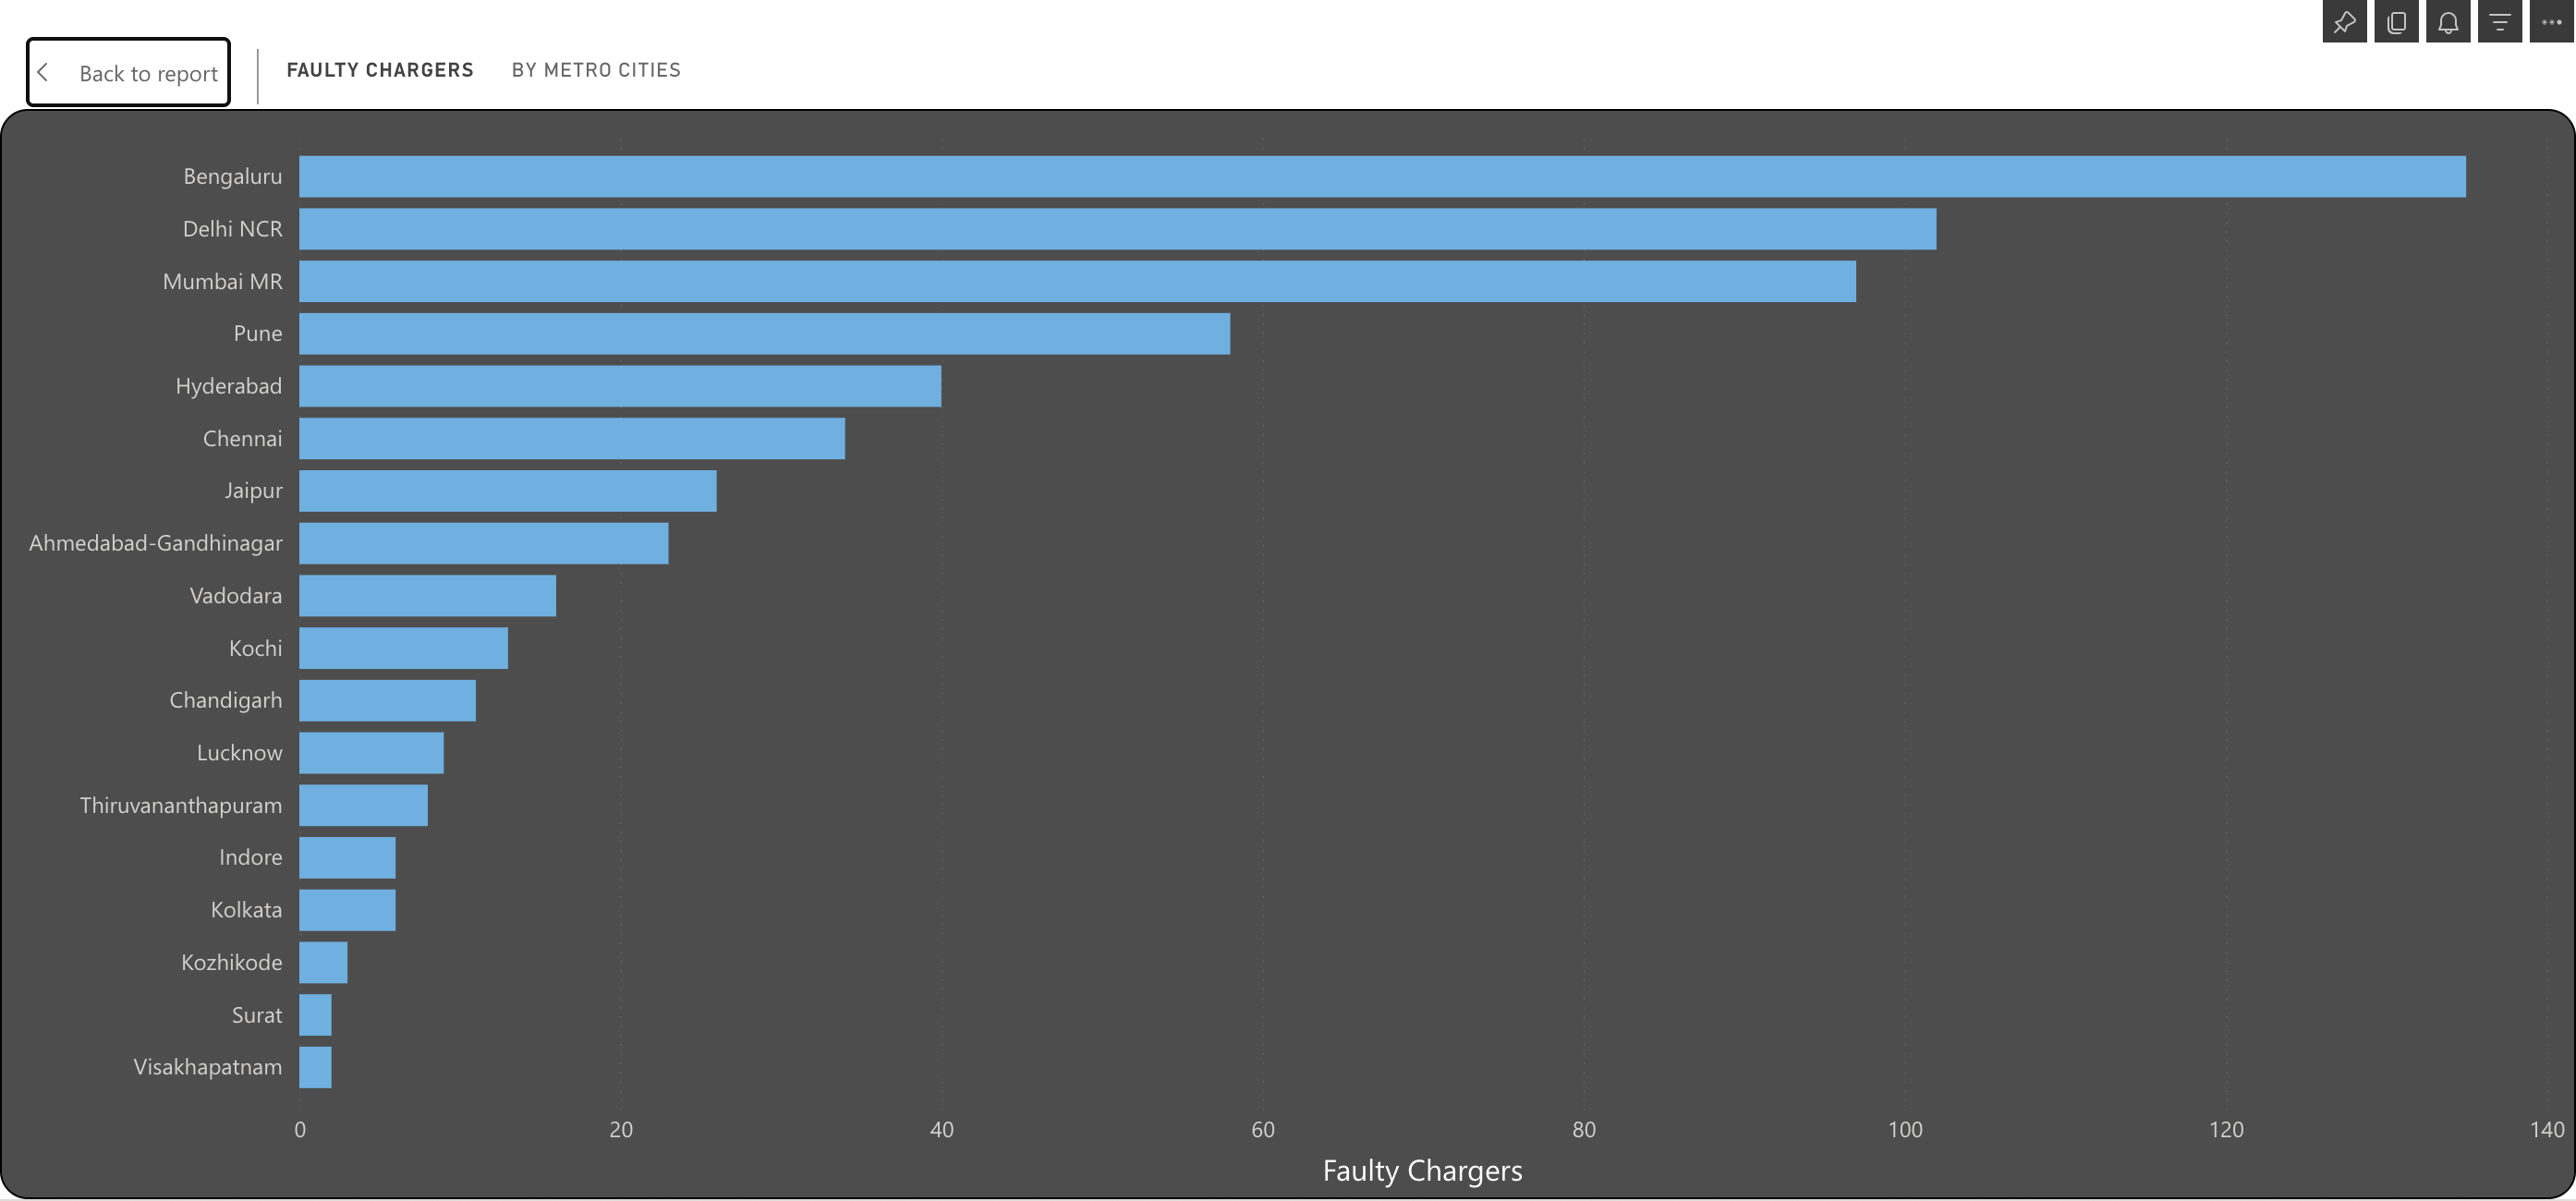
The order changes a bit with Bengaluru leading now. The top three metro cities have over 100 non working chargers by CPOs other than public sector oil marketing companies. All these cities have reliable and continous power supply. Despite that, there are many non working chargers. Let me know if you want me to do a deep dive into these non working chargers.
In the premium section, we will look at pricing by CPOs across metro cities.
Groups
The biggest group organizations hosting pubilc EV chargers are as follows :
Government host the maxium, at almost 47.5% of chargers.
Two Tata group companies - Tata Motors and IHCL Hotels host the next most, at a combined ~3.8% of the public charging infrastructure.
Reliance group is next at ~1.4% of public charging infrastructure.
That’s about it in the free section of the article today. You can subscribe to study more data and insights right away.
If you want to start using EVInfraBI in your organization, please reach out to me. Details, disclaimers, disclosures, how to reach out are all mentioned here. If you are an annual subscriber or a “I <3 Independent Analyst” subscriber, then you can request a free trial for 2506 EVInfraBI right away.
You can also get a premium account by sharing and making sure that your friends or colleagues subscribe to ExpWithEVs.
Distributing this tool or the outputs from this tool in any form outside the authorized buyers is not permitted and will be considered copyright infringement.
All rights reserved with Priyans Murarka @ ExpWithEVs.
The data from here and this article cannot be repackaged or sold without explicit written permission of ExpWithEVs.

 |
|