
EV Sales in India
An overview


Today, we take a look at pan India vehicle sales data from 2020 to 2025. We look at various model level that were sold across different RTOs (Regional Transport Office) in India and understand how India is electrifying.
While we have the data for 2W, 3W, 4W and Heavy vehicles (LCV, LGV, HCV, HGV, Bus) but today, we will focus only on 4W.
Reach out if you’d like to deep dive into any of it.
Index
Battery capacities and charging impact
The article contains 10 charts and figures. All rights reserved with Priyans Murarka @ ExpWithEVs.
The charts and data from here and this article cannot be repackaged or sold without explicit written permission of ExpWithEVs.
Sponsored content funds narratives. To get the facts, pay and support independent research and insights. Become a paying subscriber to ExpWithEVs. We don’t take any ads or kickbacks.
This research has been possible with the support of our paying subscribers. Paying subscribers get access to our community and complete archive of our industry stories.
The data source is VAHAN and Telangana Transport Department. We have a 26 page interactive PowerBI on e4W sales and registration data. Please reach out to us if you are interested to buy.
Annual paying subscribers can get access to 24h access to this PowerBI. I <3 Analysts can get access upto a week.
YoY Sales
The e4W industry saw nearly doubling of sales from CY24 to CY25.
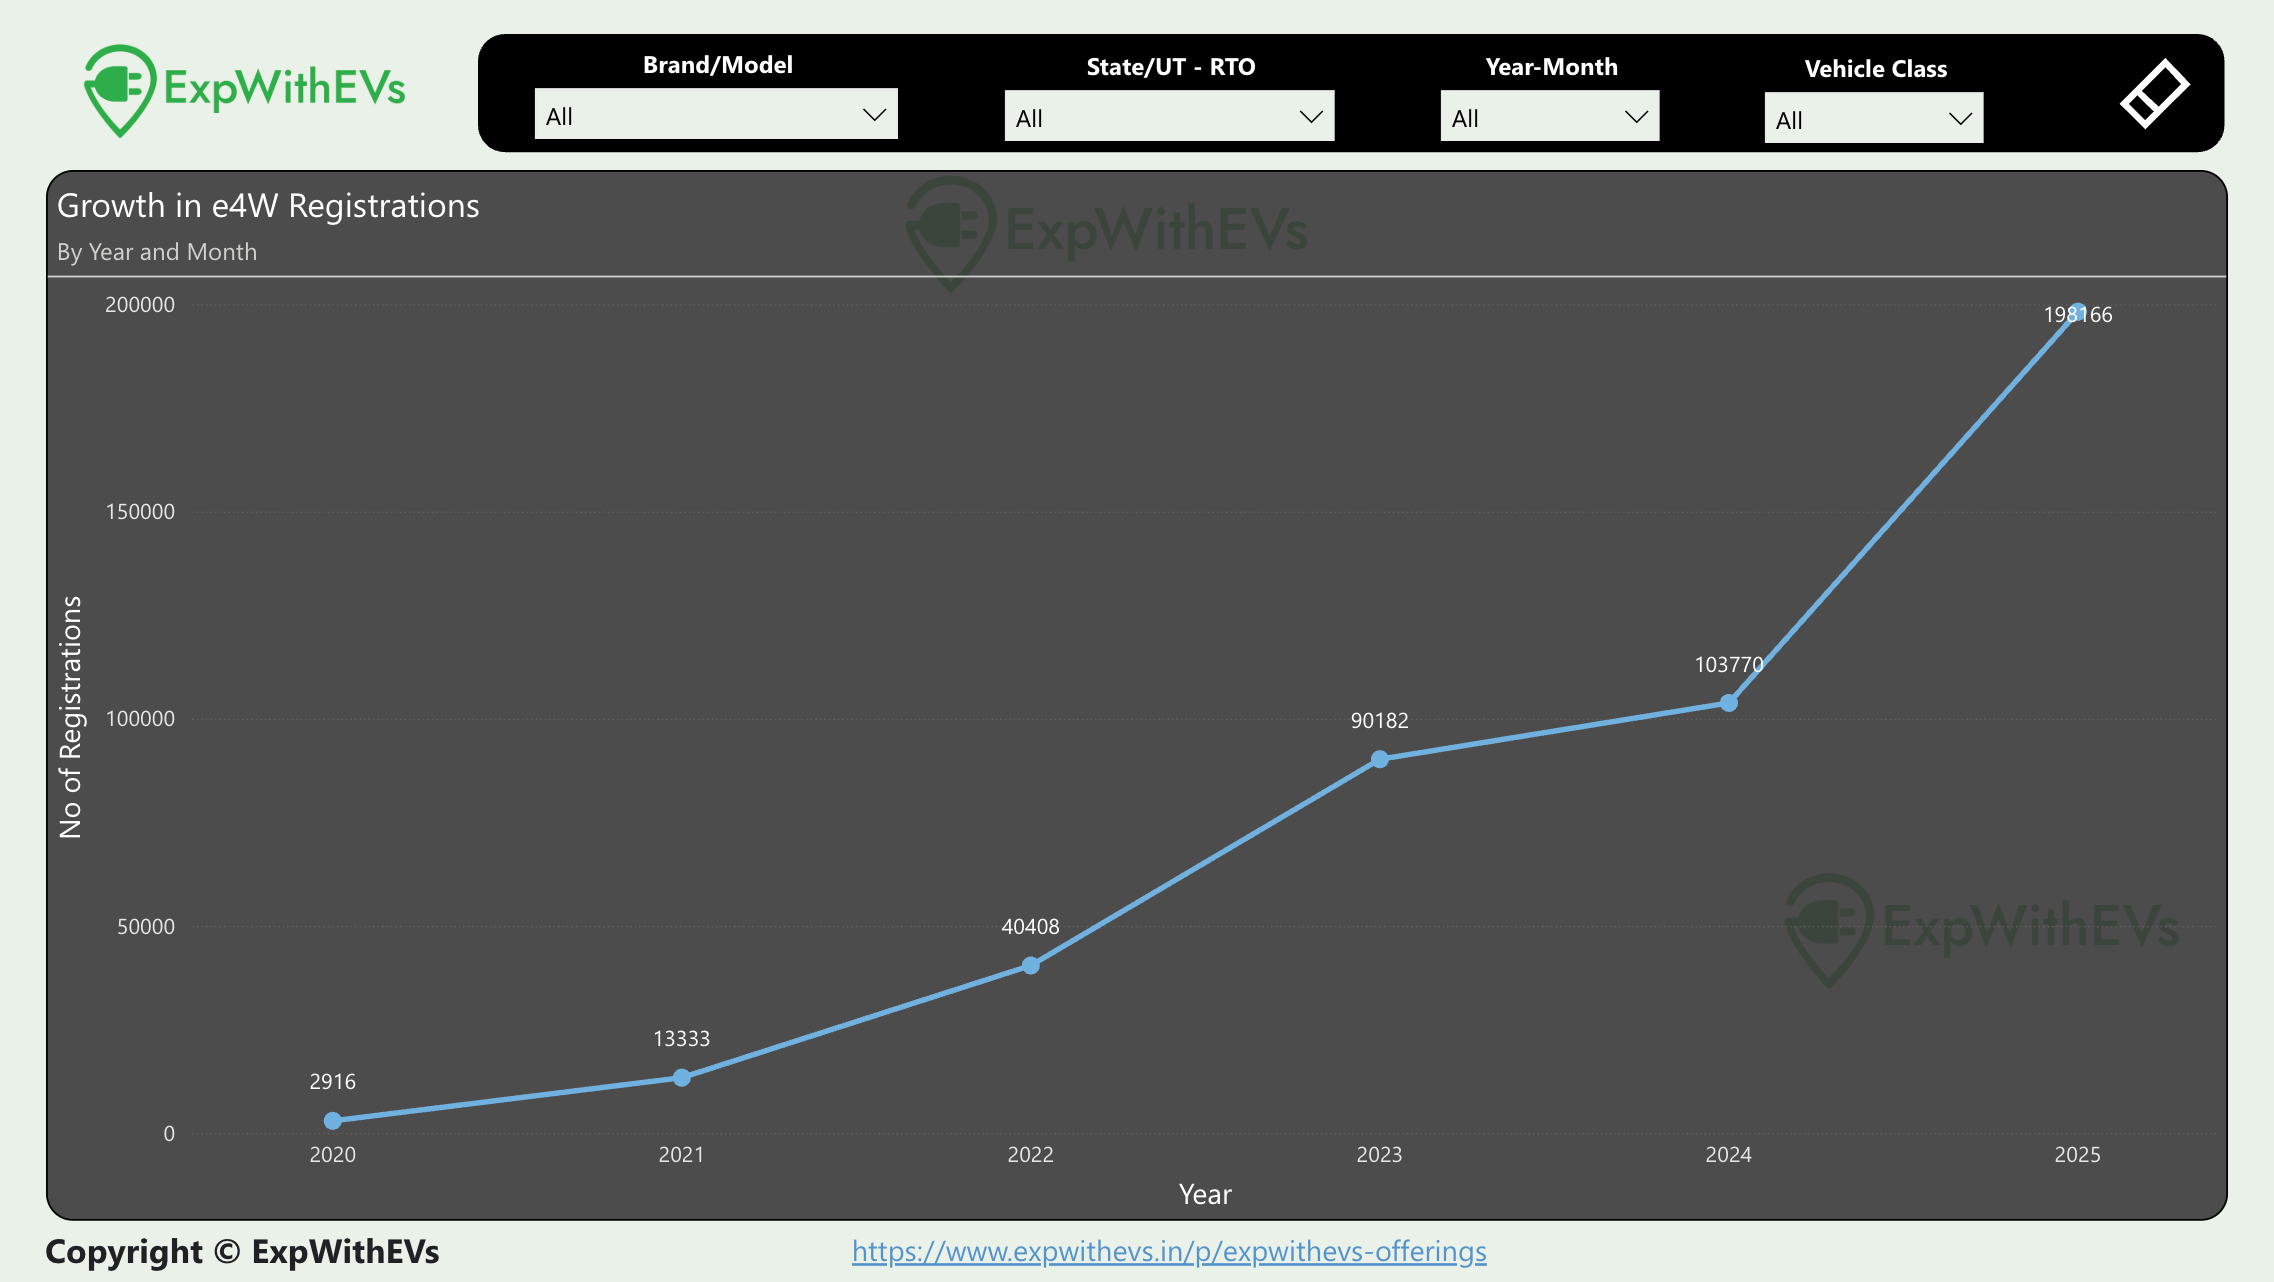
While the EV industry grew from almost nothing to ~200K cars from 2020 to 2025, the total 4W sales went up from 1.6M cars to 4.6M cars in the same time period.
The EV industry sales saw a stagnation in numbers from 2023 to 2024 because the models launched in the industry were not able to attract significant buyers. No new mass market cars, under 30L, were launched in 2024. This led to only 10% growth in the market. When OEMs don’t offer new cars to the market, it will stagnate.
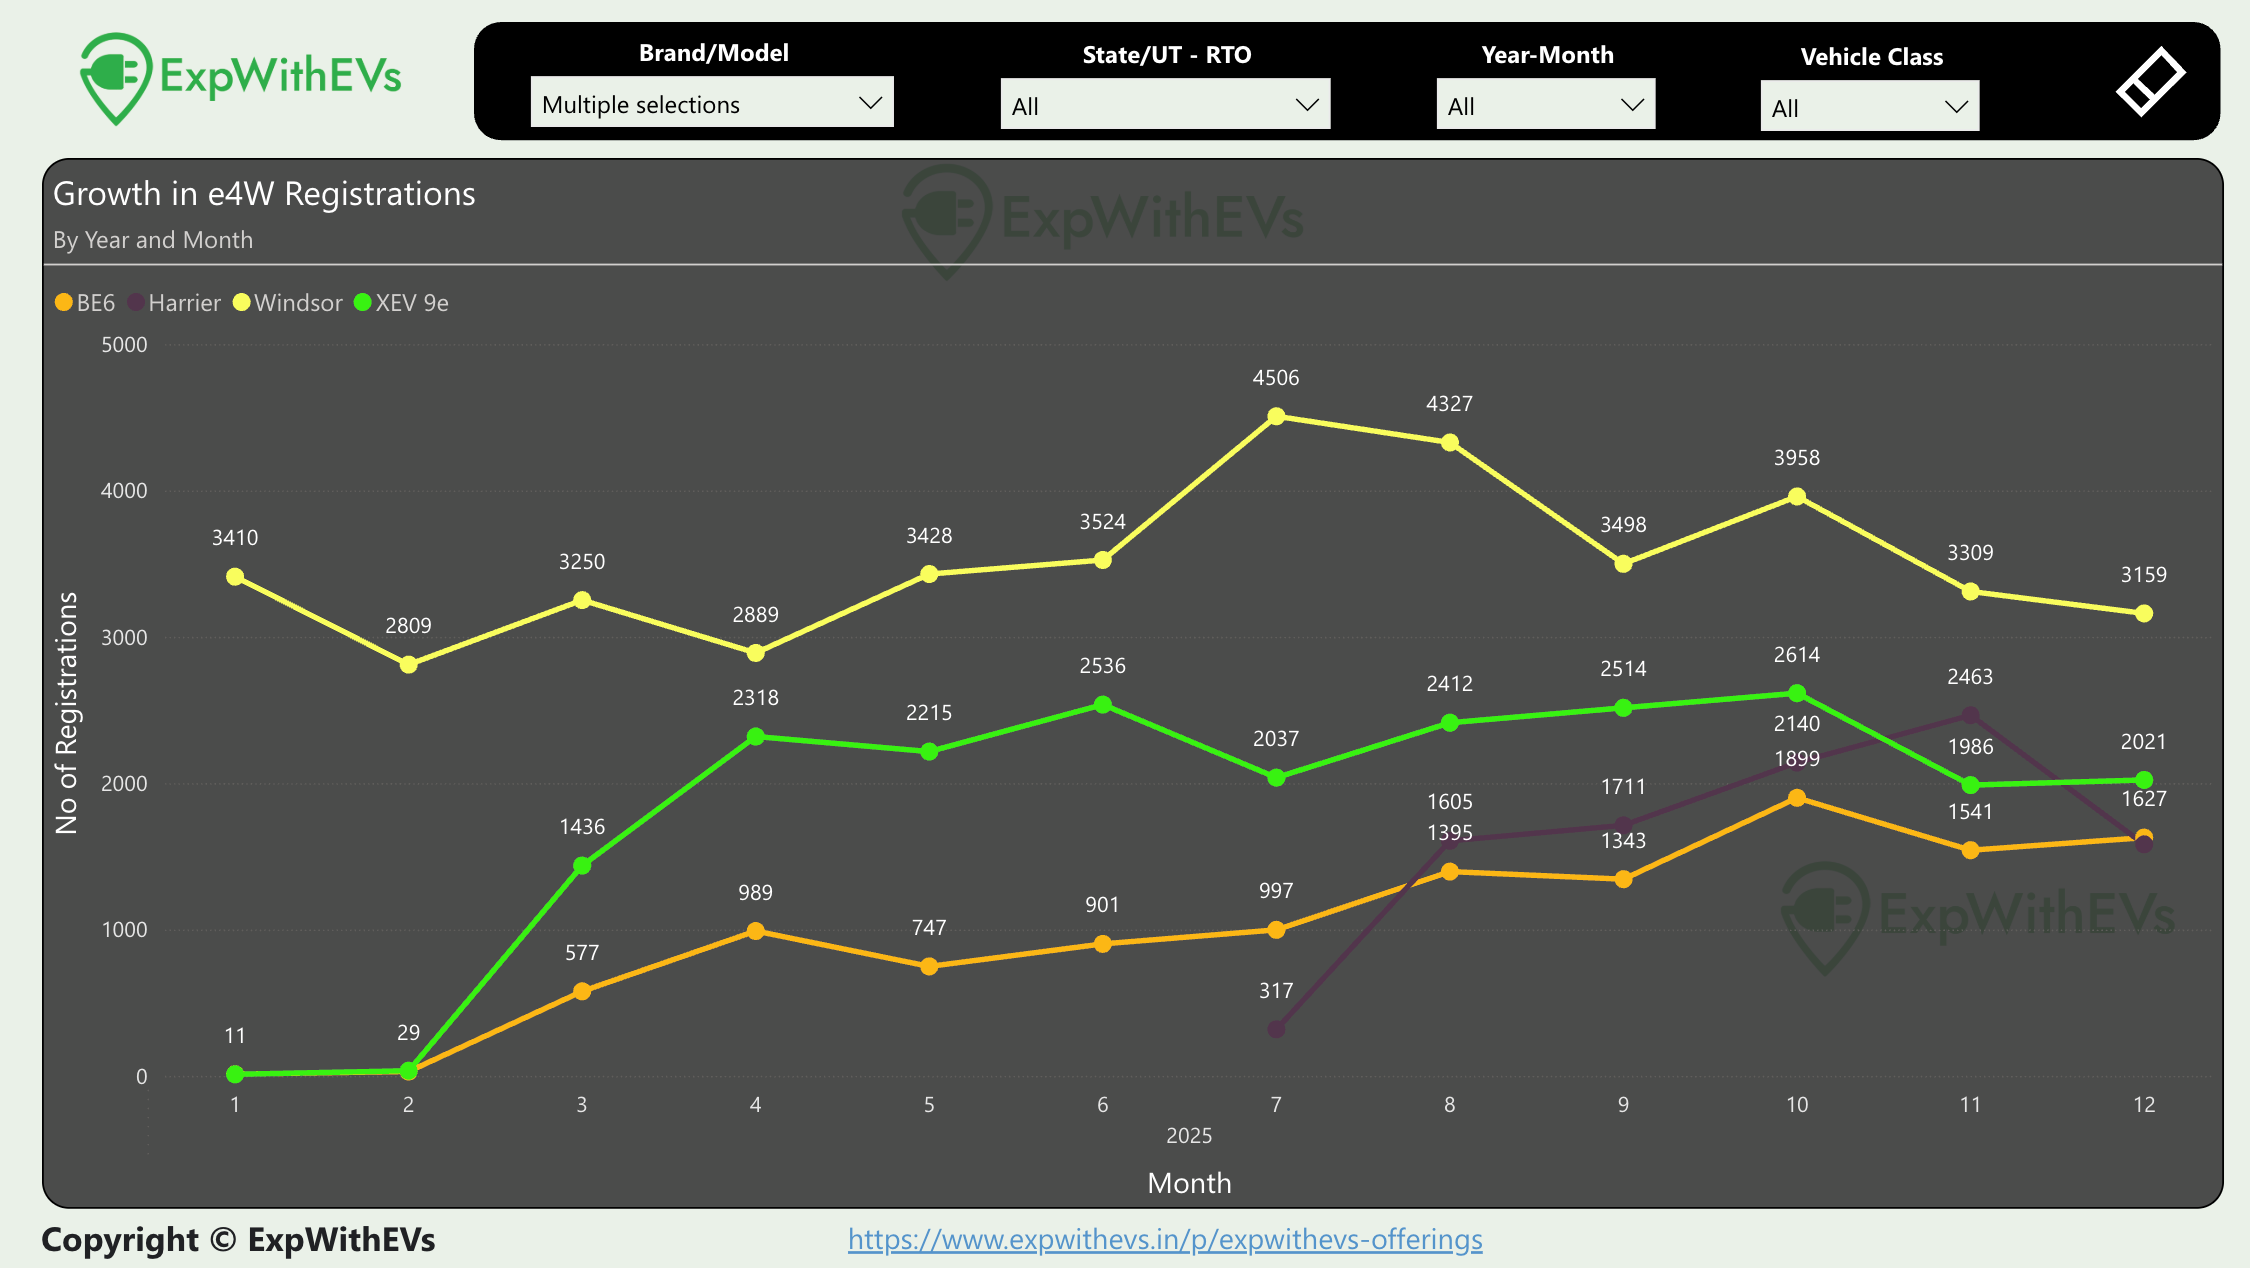
While when we look at 2025, we see the growth doubling mainly because we saw Harrier, Windsor and Mahindra Twins hit the market. These cars were lapped up by the country and accounted for almost 43% of the sales in the calendar year.
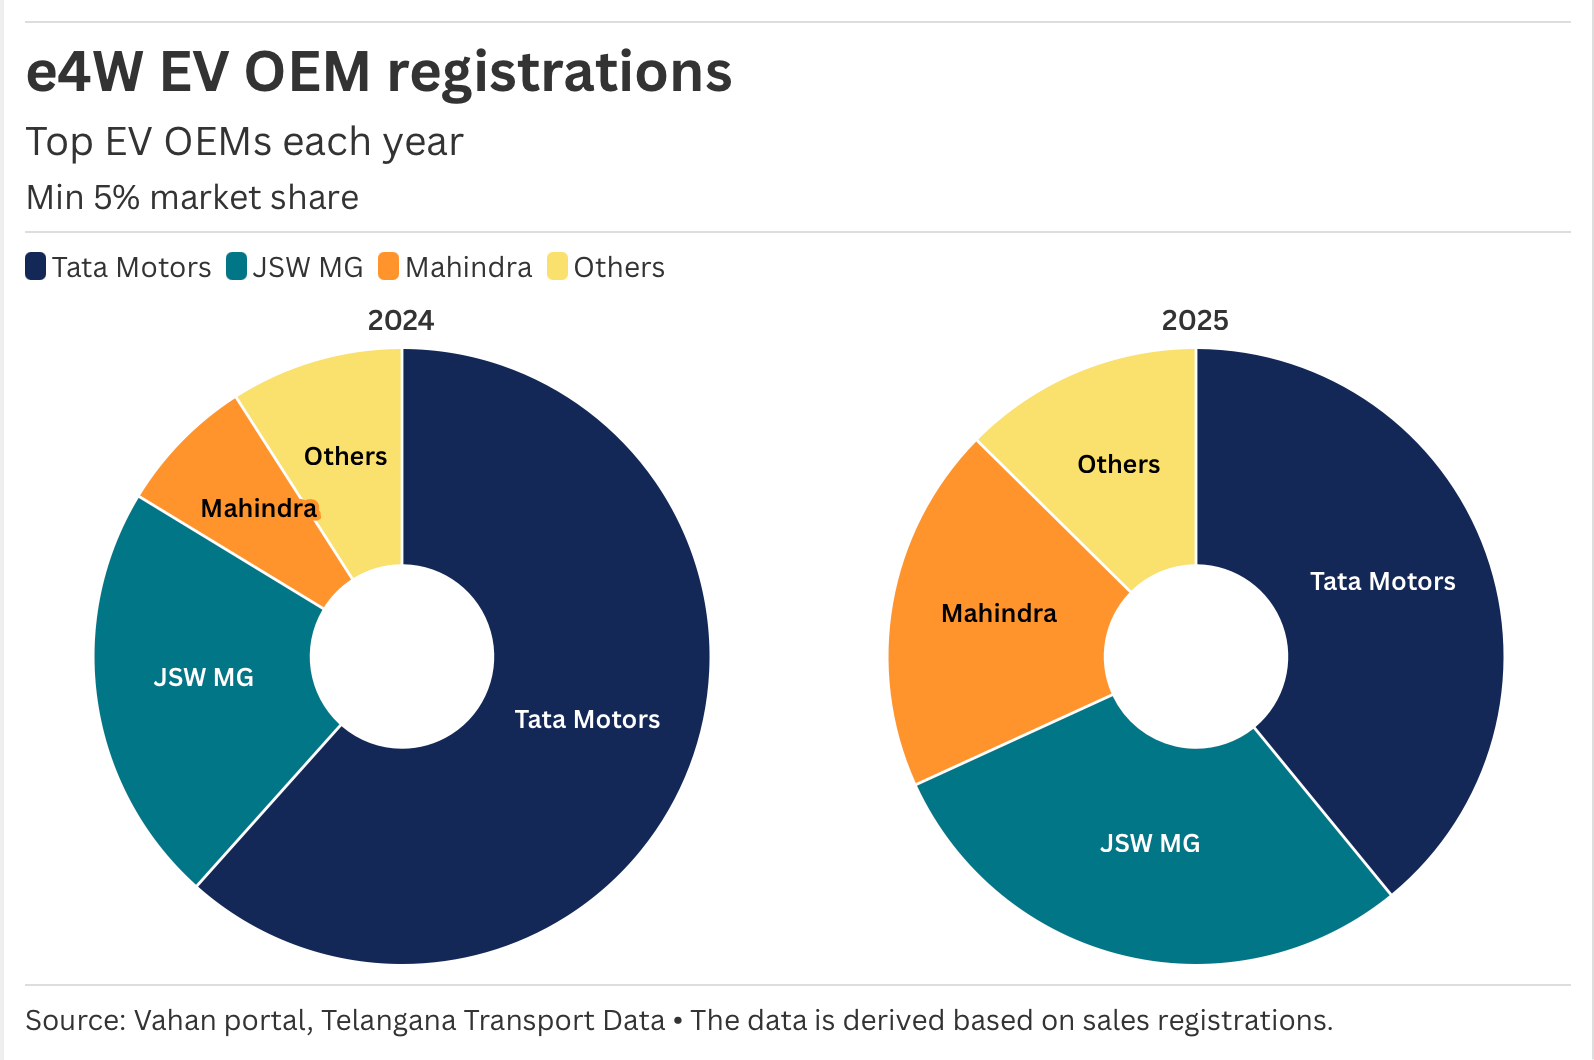
The year also saw a marked change in the OEM market share. While the industry nearly doubled, Tata Motors saw a significant decline. We can say that JSW MG and Mahindra expanded the market. Tata Motors has been leading the EV market since 2020, but in 2025, that position was challenged closely.
Not all was going in favour of EVs in 2025 though. We saw one significant GST cut for ICE vehicles that immediately pushed sales towards ICE which could’ve been EVs.
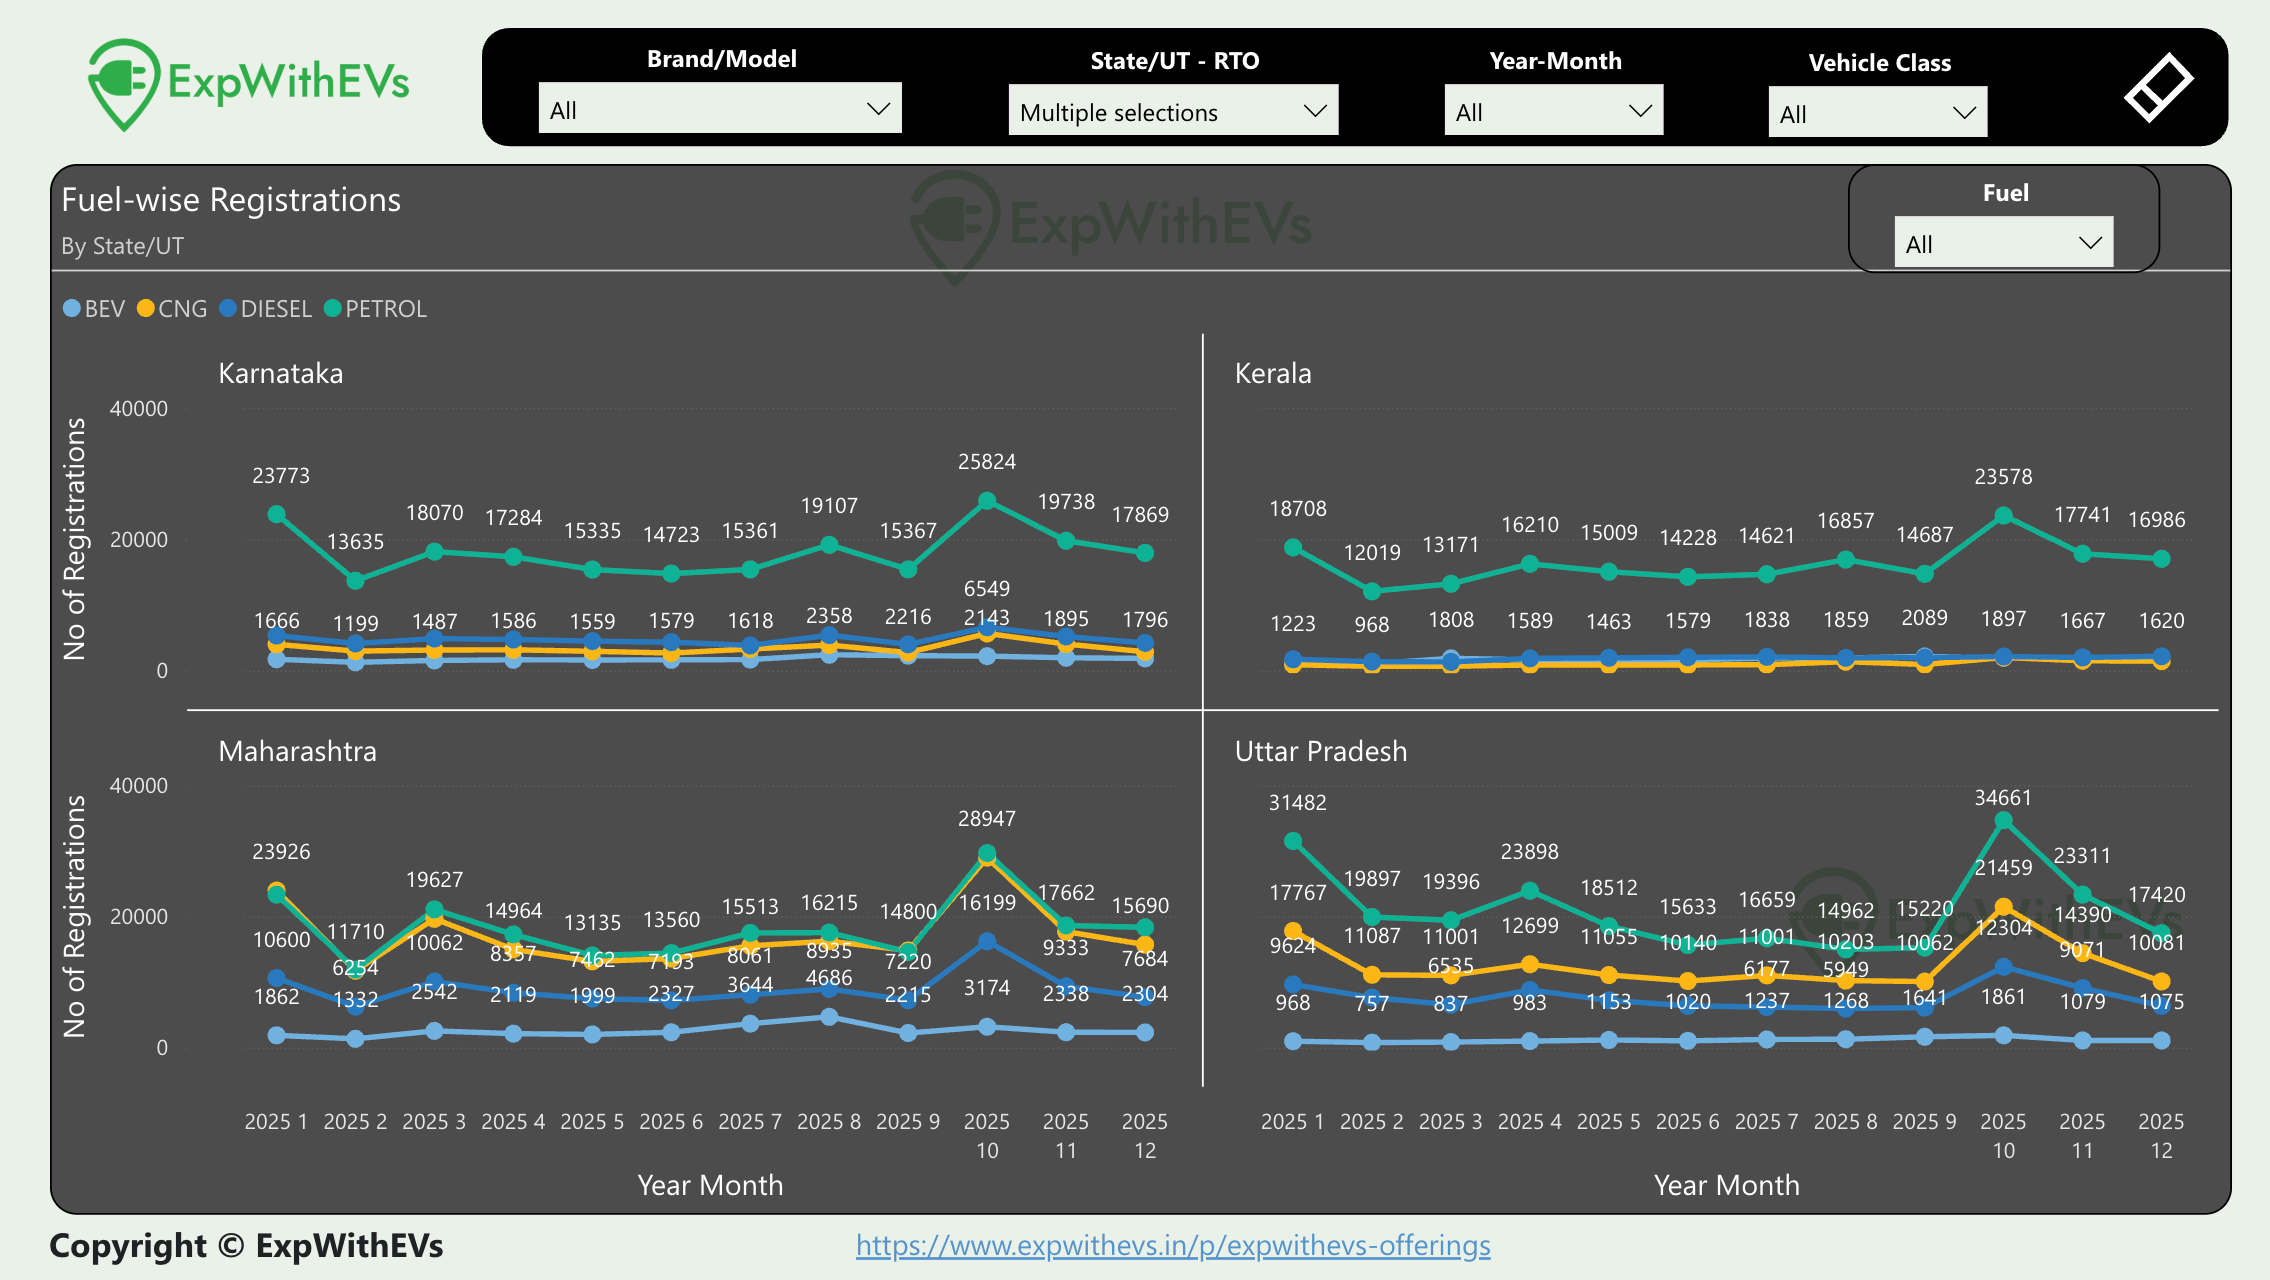
Here’s a sample of four states - Karnataka, Kerala, Maharashtra and Uttar Pradesh. We saw pickup in sales for Petrol, CNG and Diesel in Karnataka, Maharashtra and Uttar Pradesh. While Kerala only saw an uptick in Petrol sales.
It is also interesting to see that Maharashtra sells almost equivalent CNG and Petrol cars, while in Kerala and Karnataka, Petrol dominates by a magnitude. CNG, Diesel and EV sales are consistent across these two states.
While digging around, we found this to be very surprising. Jaipur RTO, the capital of Rajasthan, was responsible for most number of EVs by Tata Motors.
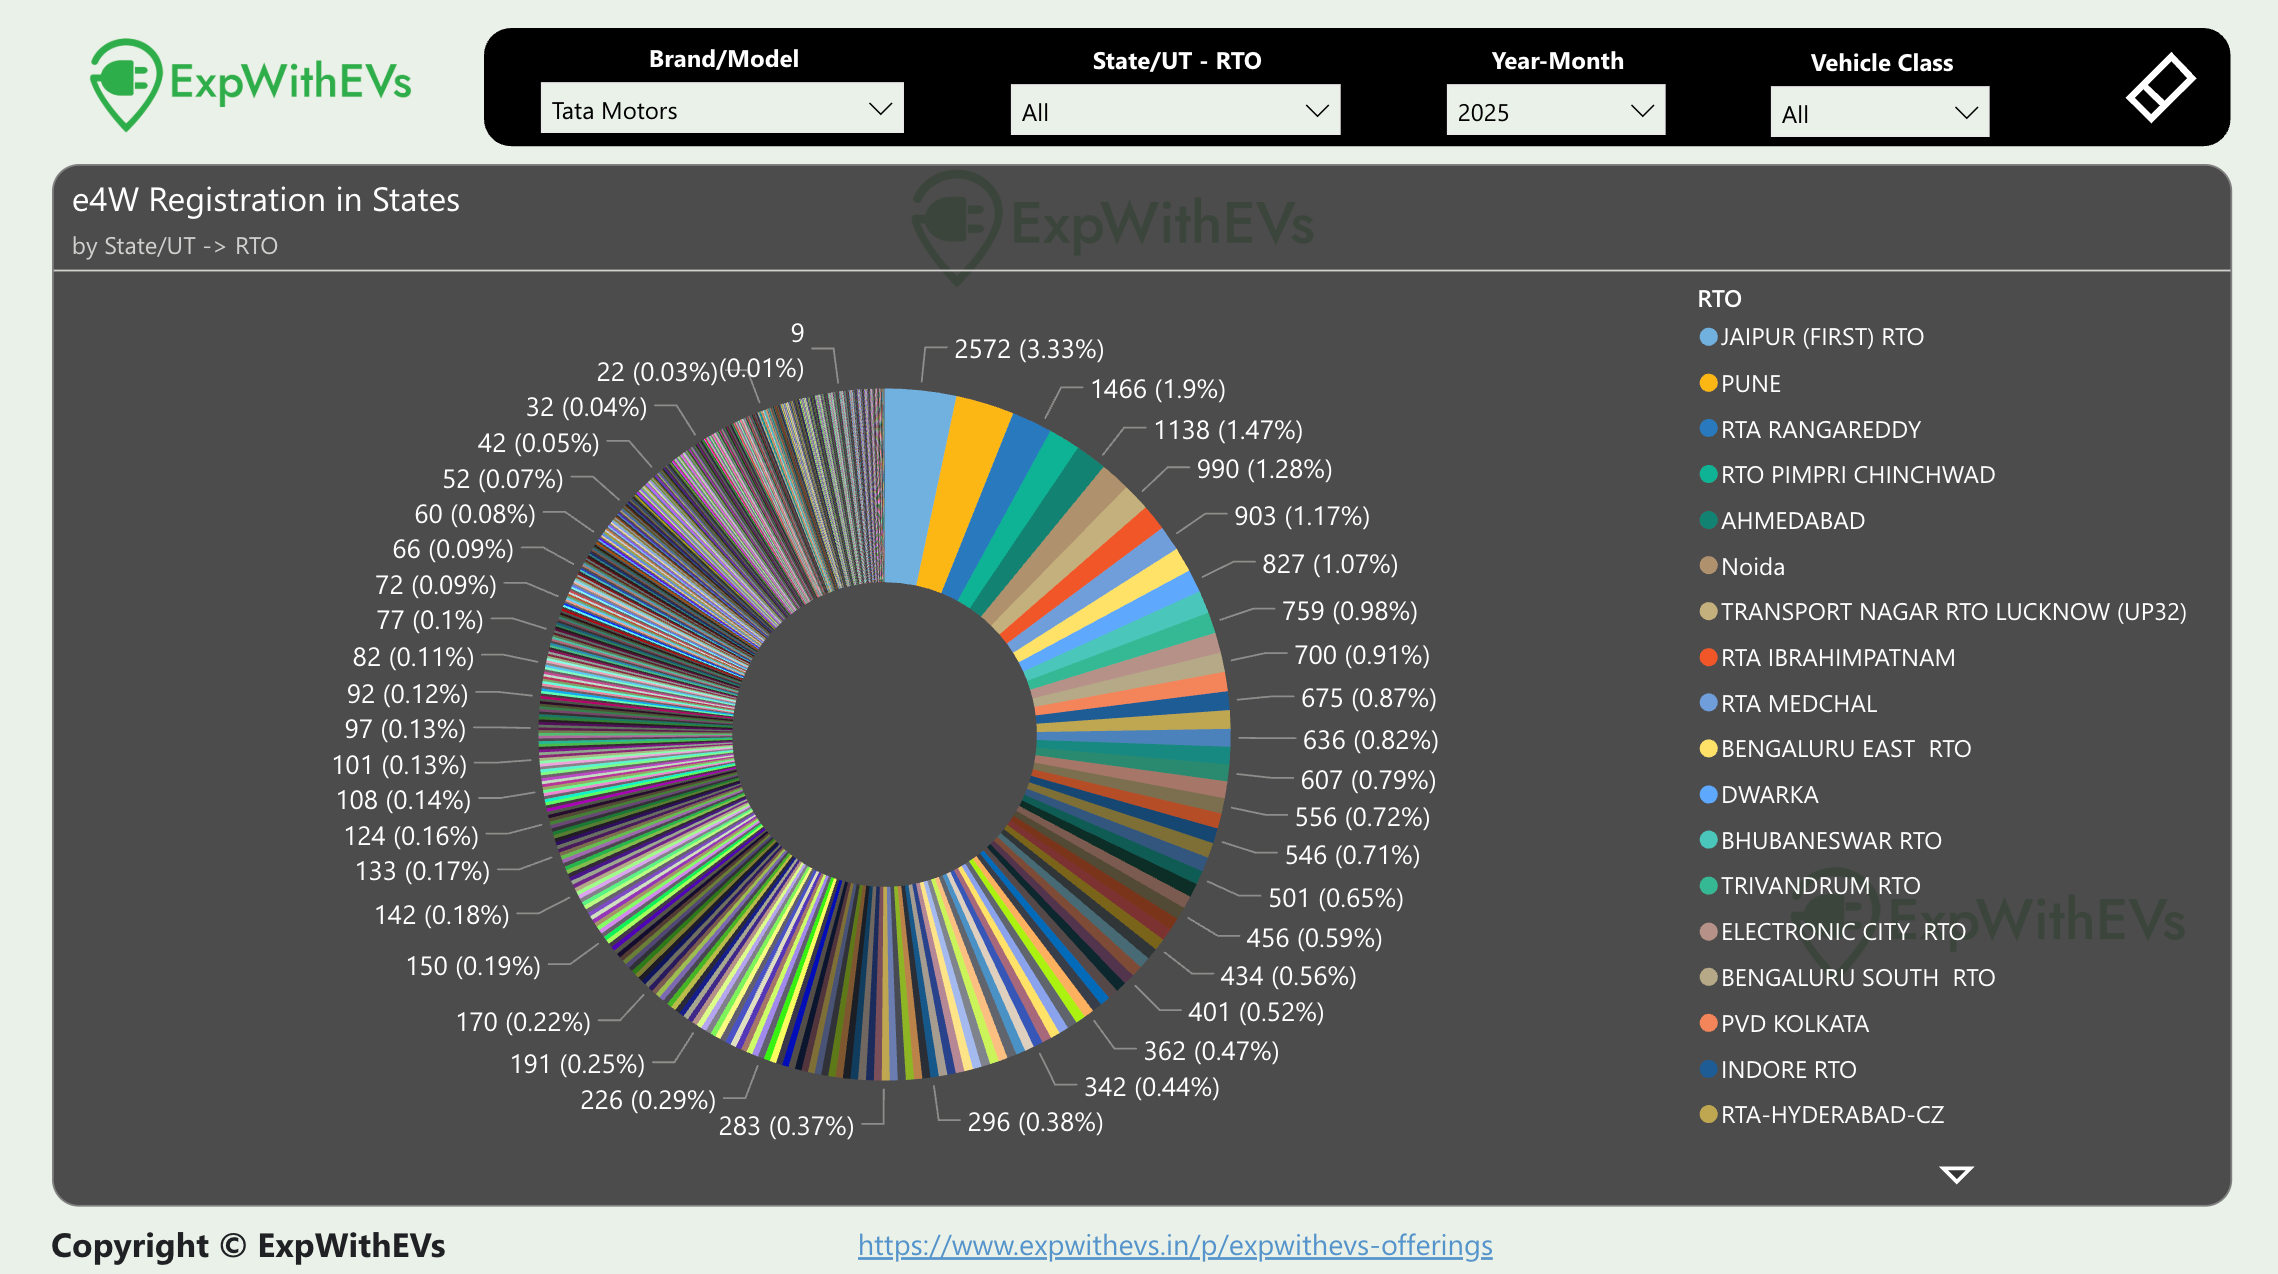
The other surprising entry in the RTOs is Ahmedabad. One usually does not see Gujarat and Rajasthan topping the automotive sales charts. The list also shows that the market for Tata Motors has moved away from Tier 1 megapolis of Mumbai and Delhi to smaller cities like Pune, Jaipur and Ahmedabad. For Delhi, only two RTOs found a mention among the top 18 - Noida and Dwarka at 6th and 11th position.
Battery Capacities and charging impact
From 2020 to 2025, India deployed a total of 18.473 GWh of battery capacity on road, not including the multiple battery replacement for Tata EVs.
In 2025 alone, we deployed more battery capacity than we have from 2020 to 2024.
Let us look at the battery capacity trends over the years. Battery capacities rose by over

 |
|