
2512 EVInfra
Dig deeper into charging infra!


Last week, we published a 10,000 ft overview of what is happening in the charging infrastructure space. Today, we will dig deeper and get more insights about the charging infrastructure.
We will talk about top ten CCS2 CPOs in India. We will understand charging station configuration, density, average charging station capacity, average power, average rating, average pricing and non working ratios. This will give us a holistic insight as to how the top ten CPOs in India are performing.
All of this information is also available in our interactive PowerBI tool called EVInfraBI. You can reach out to me to get your hands on it today!
We hope that the industry will buy our reports to help us continue to run our business without being dependent on sponsorships and advertisements. Alternatively, you can choose to become a premium subscriber.
Index
Charging station configuration
Average Charging Station Capacity
Housekeeping
Our data and comments got quoted in Mint! Read here.
We are posting this from Bangkok. We attended EVCharge Live event and stay tuned for our insights.
If you’ve been in our community group, you must’ve seen a photo of upcoming road trip! Stay tuned, the articles are shaping up really well :)
Acknowledgement
EVInfraBI was created by Priyans Murarka and Garvit Singh. This wouldn’t have been possible without the efforts of our data entry team.
All rights reserved with Priyans Murarka @ ExpWithEVs.
The data from here and this article cannot be repackaged or sold without explicit written permission of ExpWithEVs.
Summary
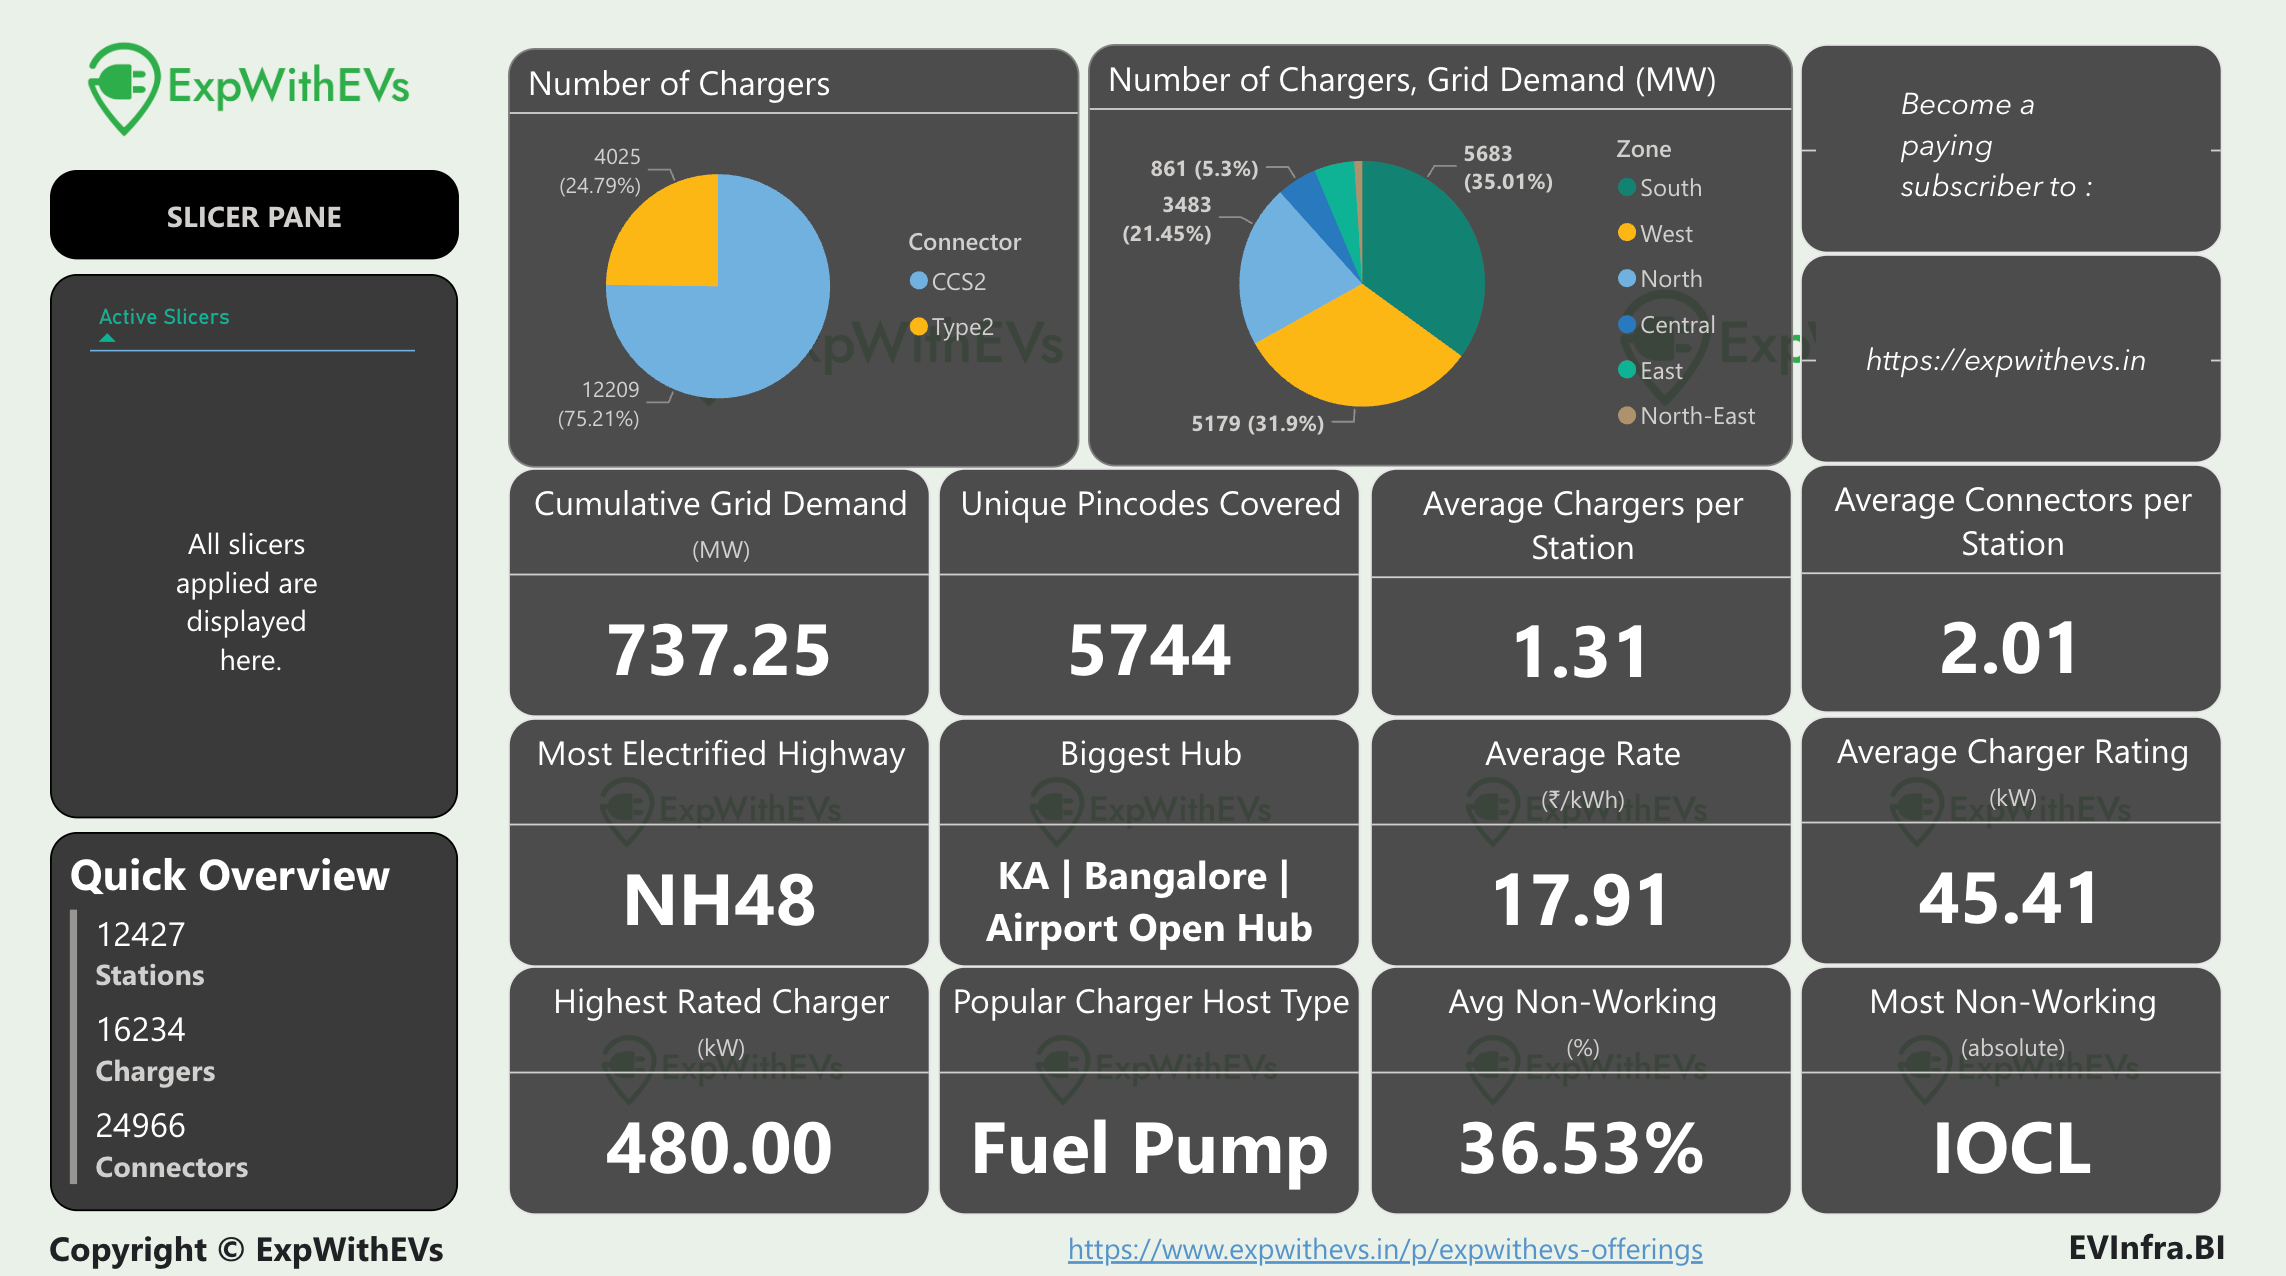
We have almost breached the 25000 public connector mark with the coverage of 79 CPOs. The charging infrastructure is showing great signs of growth and improvement. It is now present in 29.3% of the pincodes in India.
The public charging infrastructure grid demand is mere 0.15% of the installed power capacity in India. As noted in our previous report, the average non working chargers have gone down to 36.53%.
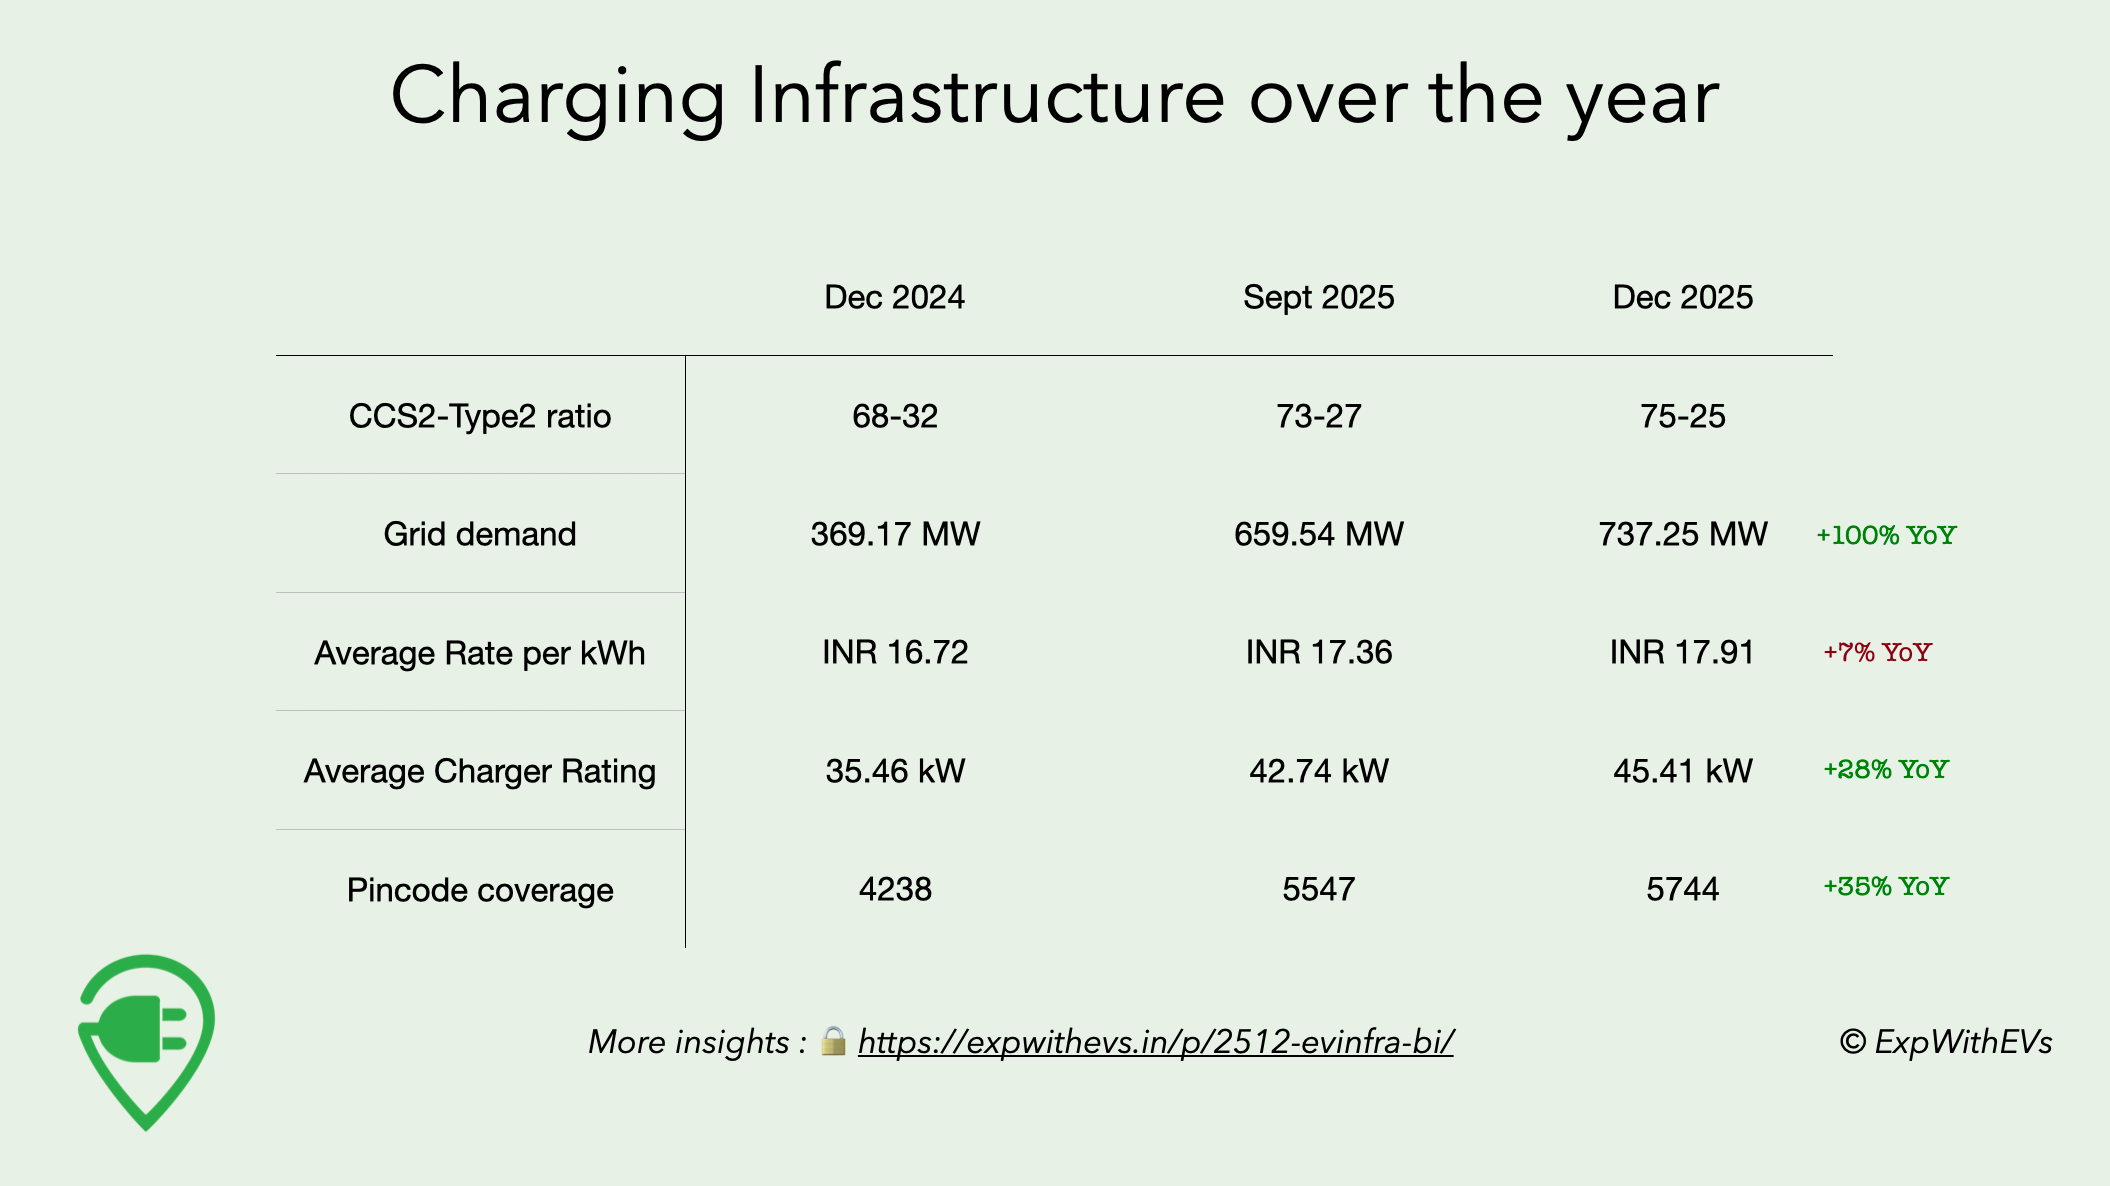
The cumulative grid demand is up 12% QoQ, 100% YoY. The average charger rating is up 28% YoY. Both of these metrics point that the industry is expanding its infrastructure both in terms of number of chargers as well as the capacity of these chargers.
Part 2 is now live.
We are changing the way we are publishing our market reports. From now on, reports will be behind the paywall only.
You can subscribe to read the article, and more from our archive! It will help us continue publishing these reports and to do more.
Alternatively, if you’d like access to the insights you can get access to our PowerBI dashboard, by reaching out to me.
Overview
The charging infrastructure has become

 |
|