ChargeZone Insights for April 2023
How India charges on ChargeZone’s network.
In May 2023, ChargeZone’s LinkedIn page published their consumption patterns for the month of April.

I’ve written about Charge Point Operators (CPOs) here and here. The CPOs run a business that is crucial to the entire EV ecosystem. People won’t buy electric vehicles if they don’t see reliable charging infrastructure. CPOs are thus expected to provide continuous and reliable charging infra which is a capital intensive business.
Most big players in the CPO ecosystem are either from big corporate groups - Tata, Reliance or startups who have raised external funding like Statiq, ChargeZone. In both cases, the companies are responsible to their shareholders and investors in the business.
Currently, Tata is the biggest CPO with around 1500 DC FC guns, followed by BPCL (over 500). Then, ChargeZone, Statiq, Fortum and Jio BPPC with similar charging infrastructure of around 100-200 DCFC charging guns.
With actual numbers coming from a moderately big player like ChargeZone, it can also provide us a good estimate of how the industry is progressing. I wanted to understand when Indians like to use the fast chargers, do they prefer to charge on the weekday v/s weekend, what time is the best time to go to a charger and not see it occupied.
In future posts, it would be interesting to see if back of the envelope math shows the path to profitability for these companies to make the ecosystem sustainable.
This is the first time that some charge point operator has put out this detailed data. I extracted the data and analysed the data with the help of my friend Janvi Nerurkar. We found many interesting patterns from just one heatmap worth of data, but are focusing on the ones we found most insightful in this article. If you’d like to skip it and analyse the data yourself, here you go - data & Janvi’s github for the code.
Please feel free to tag and alert us incase you find more interesting patterns!
This post is supported by ActiveBuildings. Get your indoor air quality tested for as low as INR 699/- Why you ask? Here’s why.
Disclosure : I am the cofounder of ActiveBuildings
Context
Tata PEZC & BPCL lead the pack with a high number of charging guns in India. As per my Feb 2023 report (link), ChargeZone is with Fortum, Jio BPPC and Statiq competing for the third place.
ChargeZone is known to have electrified Ahmedabad to Bengaluru (~1500 km highway), along with some destinations around Delhi. ChargeZone serves B2C as well as B2B customers like Fleet Operators. Typically, ChargeZone chargers are mostly found at Food Malls on the highways and Marriott properties.
How did we get this data?
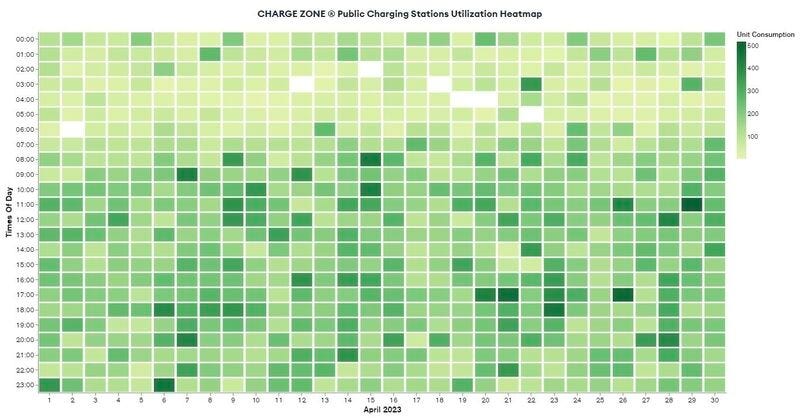
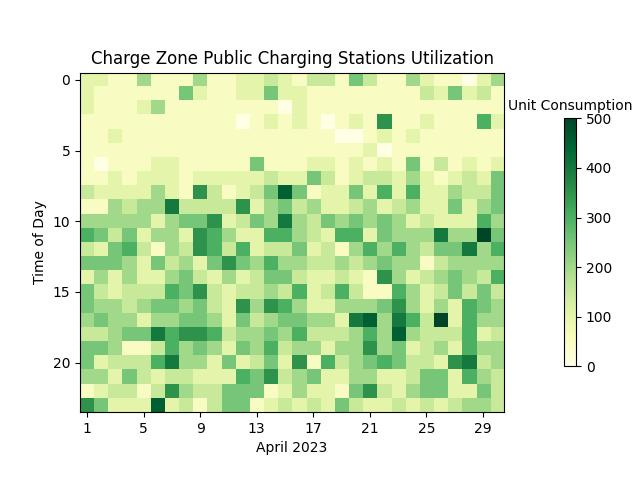
We took the image from the LinkedIn page. Janvi ran some computer vision magic via Python- which is available for you to see here.
We assigned energy units to each pixel colour between white (0 kWh) and dark green (500 kWh), so the machine could use that as a reference to “read” the heatmap just like we do. We also converted the original gradual gradient into a step gradient of 50 units for an additional level of detail. Finally, we plotted this extracted data and compared it to the original heatmap image. As you can see, we were quite successful in our endeavour.
As per my Feb 2023 report, ChargeZone had 155 CCS2 DCFC and 4 AC Type 2. It possibly also has DC001 type of chargers. We are assuming that all the load is of CCS2. The number of chargers may have also increased in 2 months from Feb 2023. For this post, I am assuming 185 DC fast chargers in total. We asked ChargeZone via email about the total number of fast chargers. The post will be updated once we get a response.
Assumptions
Before we dive into the data and the analysis, here are some of the assumptions we made. All discussions are with the caveats mentioned herein.
Karthikey, CEO of ChargeZone confirmed that the average energy dispensed in one session is 20 kWh. I also ran a poll on multiple Telegram groups, which confirmed that most users prefer charging for 15 - 20 units in a single session.
We are going to assume that it takes around 40 mins to top up 20kWh. This tallies with ChargeZone having a high number of 30kW charging guns. Most cars on the road are Nexon EV and it takes a similar amount of time to add 20kWh in the battery for the NexonEV.
Yes, ChargeZone has high power chargers and yes, there are many cars that can charge a lot faster / slower on the network. But for simplicity sake, we are not going to consider their impact in this blog post. Similarly, ChargeZone also delivers chargers for vehicles other than 4 wheelers. We have asked ChargeZone about different types of loads. The post will be updated once we get a response.
Holidays considered are :
Dive In
Money
ChargeZone dispensed a total of 1,10,900 units of energy in April 2023. The average rate per unit is ~INR 25 (US$0.3), inclusive of taxes. Thus, from charging operations, ChargeZone earned a revenue of INR 27,72,500 (US$33,650) in the month of April 2023.
Charge Point Operators (CPOs) install chargers under various models. Sometimes the CPOs pay only rent to the property owner, sometimes they have revenue sharing models with the location owner. Sometimes the entire amount may be given to the location owner. This impact is not included in our calculations.
When a charger is installed on a site, the state electricity discom (distribution company) charges a fixed load to the installer. Let’s assume that for a 60kW connection, the discom charges an average of INR 300 / kW / month. Most sites for ChargeZone are dual gun and 30kW each, we can assume a total of 92 such sites. Thus the minimum fixed expense for ChargeZone is INR 16,56,000 (US$20,100), to ensure the chargers are energized.
There are more expenses and revenue streams for a Charge Point Operator, but that is reserved for a separate blog post.
When do Indians like to fast charge?
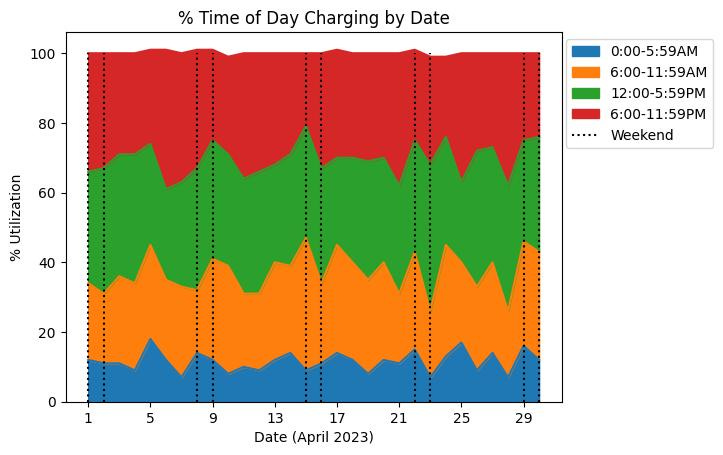
The data shows that fast charging is mostly done from 12:00 noon till 11:59 pm. People prefer charging in the morning from 06:00 to 11:59 am compared to 00:00 to 5:59 am. The data fits the pattern of how people prefer to road trip in the day time v/s late night time.
Electricity costs vary as per the time of the day. The costs are lower post midnight because the demand is lesser. This also means that the probability of a fast charger being occupied is higher from 12:00 noon till 11:59 pm v/s other times of the day.
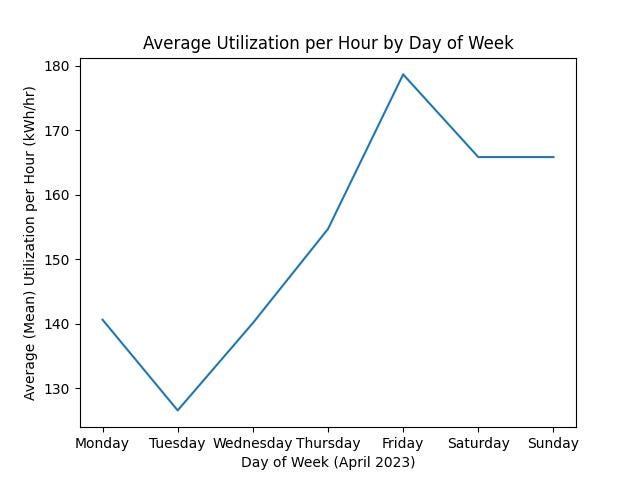
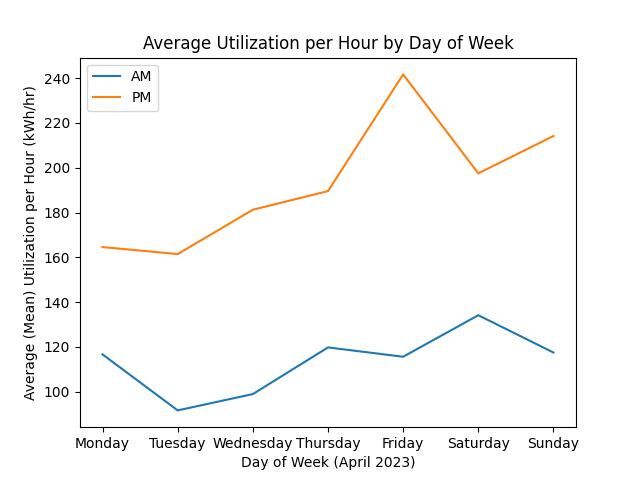
Comparing Fig 5 and Fig 6, it is seen that there’s an increased load dispensed on the weekends, but the above patterns still follow. The total demand from Mon - Thu is around 10% higher than Fri - Sun.
Fig 7 confirms our hypothesis about Indians consuming more units in the second half of the day v/s the first half.
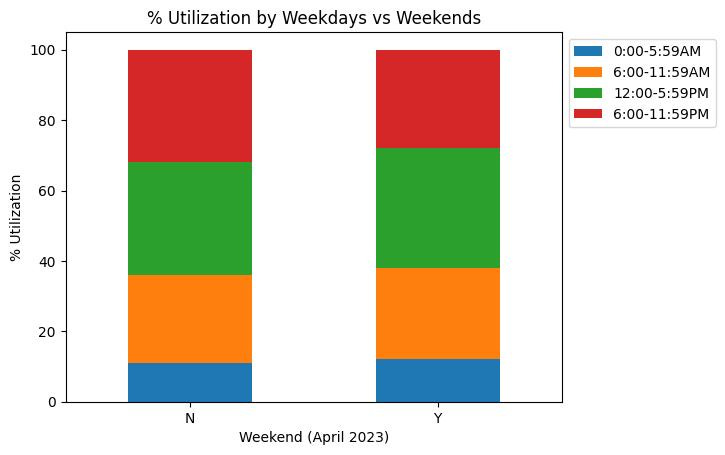
Fig 8 takes the split of the consumption happening across various times of the day and the numbers are similar whether it is the weekend or the weekday.
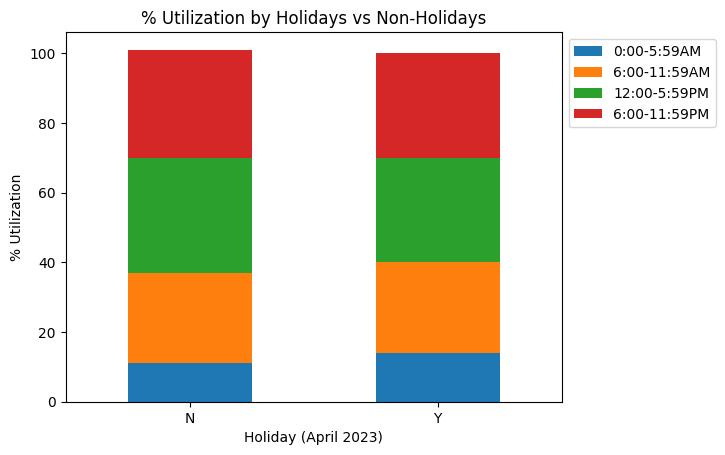
April 2023 didn’t have any major holidays like Holi, Diwali or Christmas. We will have to see the impact of consumption numbers during these holidays. None of the holidays were celebrated nationwide, so they may not have had an effect on the daily routine of EV users.
The weekday and weekend charging patterns follow a similar trajectory throughout the day.
What does the data say about the network and the industry?
The CPO business is very tough. ChargeZone is a moderately sized network and with them doing a topline of ~INR 30L (US$36k) per month translates to optimistic annual revenues of ~INR 5 Cr (US$600k). I’ve accounted for generous growth in income for the charging network in the current financial year.
As discussed on the TeslaClub India podcast with Ravin (link), a company with 100s of chargers has invested upwards of INR 25 Cr (US$3M). Given that ChargeZone has close to 200 chargers now, they must have invested at least INR 50 Cr (US$6M).
It is heartening to see that VCs are also interested in investing in infrastructure. ChargeZone raised US$54M in their last round. It only makes sense to continue expanding the network and lock in the CapEx, given the rate at which the demand is growing.
ChargeZone dispensed 1,10,900 units of energy, with an average session of 20 units, totaling 5,545 sessions across 185 chargers. This translates to roughly 30 sessions / charging gun / month which is basically 1 session / charging gun / day. 1 session to dispense 20kWh would approximately take 40 mins. The charger can be operational for 24 hours a day. Thus, the utilization rate of the network is ~2.7%.
Low utilization rate is a double edged sword for the consumer. It means that at most times and locations the consumer can charge their car without having to worry about waiting. The consumer can also expect the prices to rise dramatically if the industry loses the favour of capital in the markets.
Without considering any location preferences, you can go to a ChargeZone charger at any time of the day and are likely to find at least one gun available. Best times would be from 01:00 to 06:00 am and best days would be from Monday to Wednesday.
ChargeZone’s utilization rate is the typical industry standard. As with the other players in this industry, ChargeZone will have to continue raising money to put up chargers to reach charger saturation. Electric vehicles haven’t breached the 10% number of all new cars sold in India. This means that there is ample space for the industry and the players to grow. According to private conversations I’ve had with charge point operators, CapEx level break even happens at as low as 4% utilization rates. EBITDA level profitability only kicks in at 12.5% and above. Profitable businesses tend to be sustainable long-term and ChargeZone have their work cut out to reach those numbers.
Based on these numbers, we can assume the CapEx invested by Tata PEZC and BPCL must be around 300 Cr (US$36M) and 125 Cr (US$15M) respectively. There are 4 players similar to ChargeZone in the market. Thus the total CapEx invested towards charging infrastructure in India is around INR 625 Cr (US$75M).
If the entire industry’s utilization numbers are similar to ChargeZone’s, then the total energy dispensed in April 2023 is just around 1.4 GWh. Thus, annual energy dispensation, optimistically, is around 25GWh. India’s renewable energy capacity till Feb 2023 was around 169 GWh.
What does this all mean?
In the short term, you are lucky to own an electric vehicle. The charging stations will be sparsely populated and can be utilized by you at all times of the day. The industry is currently being funded by investors and people with big money. Thus the charging costs are currently low and the network is rapidly expanding to drive adoption. I’d make full use of that and travel as much as I can on these networks.
The charging costs will go up only if there’s a significant policy change or if the adoption of electric vehicles doesn’t pick up in the next 2-3 years. Both these assumptions seem highly unlikely. On the contrary, if the government brings in favourable policies to reduce their oil import bill, then the rates may go down. The pricing can also go down if the networks start seeing an uptick in their utilization rates which brings them closer to EBITDA levels.
This post has limited graphs. Check out more graphs on Janvi’s github and comment your analysis!
Janvi is based out of Boston, MA and is currently looking for roles in data science. If you are interested in reaching out, check out her LinkedIn.
This piece can be re-published (CC BY-NC-SA) with a line mentioning ‘This was originally published on ExpWithEVs Substack’ and a link back to this page. In case of re-publishing, please alert priyansevs@gmail.com
Author : Priyans Murarka
Data Scientist & Editor: Janvi Nerurkar
Acknowledgements: Karthikey (CEO of ChargeZone), survey participants


